Resource library

Guides, templates and practical resources to help you design better surveys, collect reliable data and get more out of KAPsurvey.

Leveraging Advanced Spatial Data in Field Evaluations

Leveraging Advanced Spatial Data in Field Evaluations

Capturing a single set of GPS coordinates at a front door is no longer enough for modern impact evaluations.

Whether measuring agricultural yield, assessing post-disaster infrastructure damage, or mapping water point distribution across rural districts, field teams require rich geospatial context. Yet, most research teams are forced to equip enumerators with two separate devices—or two different apps—one for completing the verbal survey and another for collecting GIS spatial data.

Carrying separate tools creates immense operational drag, increases hardware costs, and guarantees spatial data mismatch during analysis.

The Bottlenecks of Basic Location Capture

Relying on standard location pins or secondary mapping applications introduces severe technical barriers during field operations:

  • Distorted Acreage & Boundaries: Asking farmers to estimate plot size verbally leads to massive reporting bias. Without native polygon mapping, teams cannot accurately verify land area, agricultural productivity, or intervention scope.
  • Disconnected GIS Layers: When enumerators collect spatial data in a standalone GIS app and survey responses in a separate form builder, analysts spend weeks attempting to align timestamps and household identifiers to join the datasets.
  • Offline Map Failures: Generic forms pining a GPS coordinate often rely on live Google Maps tile servers to show background maps. In zero-connectivity zones, enumerators see only a blank grey grid, rendering visual spatial verification impossible.

Integrated Geospatial Surveying

To capture reality with exact precision, research software must treat spatial data—points, lines, and complex polygons—as native survey elements.

This is where KAPsurvey elevates field operations. The platform embeds full geospatial mapping capabilities directly into the survey workflow, eliminating the need for external GIS hardware or secondary software.

Key geospatial capabilities include:

  • Native Point, Line, and Polygon Capture: Field enumerators can trace agricultural boundaries, map pipeline paths, or record exact household clusters directly within the survey form, capturing area calculations automatically in real time.
  • Offline Vector Basemaps: Project directors can pre-load custom vector basemaps, satellite imagery, or administrative boundaries onto field devices. Enumerators maintain complete map visibility even hundreds of miles from the nearest cell tower.
  • Spatial Logic & Geofencing Constraints: Prevent data errors before submission by embedding spatial validation rules. Set geofences to ensure enumerators are physically within the assigned sampling cluster before the survey unlock, guaranteeing strict adherence to sampling protocols.

Spatial Intelligence for Greater Impact

Grounding your data in precise geographic context unlocks deeper insights, allowing stakeholders to visualize spatial patterns, proximity factors, and regional variations instantly.

Streamline your spatial data collection and equip your field teams with true mapping intelligence. Visit KAPsurvey to explore advanced geospatial features built for complex field environments.

Read more→
Safeguarding Beneficiary Data Demands Enterprise-Grade Security

Safeguarding Beneficiary Data Demands Enterprise-Grade Security

When conducting field research among vulnerable populations—whether evaluating refugee assistance programs, tracking maternal health interventions, or surveying financial access, data security is far more than an IT checkbox. It is an ethical obligation and a core programmatic requirement.

Yet, many research teams and non-profits continue to collect Personally Identifiable Information (PII) using standard commercial form builders or unencrypted cloud spreadsheets.

When sensitive survey responses are stored on unverified third-party servers, shared via unencrypted file exports, or accessed on unsecured mobile devices, your organization faces severe reputational, legal, and operational risks.

Here is why generic survey tools fall short on data protection, and how modern enterprise platforms secure the entire research lifecycle.

The Vulnerabilities of Standard Data Collection

Commercial survey tools are designed primarily for marketing feedback and customer satisfaction polls, where data sensitivity is low. When applied to social impact, health, or humanitarian studies, these generic tools introduce critical security gaps:

  • Unencrypted Local Storage: If an enumerator tablet is lost, stolen, or confiscated in a high-risk field environment, unencrypted survey responses stored on the device can be easily extracted, exposing sensitive respondent identities.
  • Lack of Granular Role-Based Access: Standard tools often provide all-or-nothing access permissions. Field supervisors, enumerators, data analysts, and external donors frequently share credentials or gain full view of raw PII that they do not need to see.
  • Unregulated Data Residency and Sovereignty: International grantmakers and national data protection authorities enforce strict regulations on where personal data can be stored and processed. Generic cloud tools rarely give you control over data hosting locations or encryption keys.

Building a Zero-Trust Data Pipeline

To protect beneficiary privacy and comply with stringent international security standards, research organizations must adopt a zero-trust approach to field data management.

This is why security-conscious organizations rely on KAPsurvey to safeguard their field operations. Engineered from the ground up with enterprise-grade security, KAPsurvey ensures that sensitive data remains protected at rest, in transit, and during analysis.

Here is how advanced security architecture elevates field data protection:

  • End-to-End Encryption at Rest and in Transit: Data collected on the KAPsurvey mobile app is encrypted locally on the device using AES-256 encryption. Even if a field tablet is physically compromised, stored data remains unreadable without cryptographic authentication.
  • Automated PII Anonymization: Project directors can flag specific survey variables as PII—such as names, phone numbers, or national ID numbers. The platform automatically isolates or redacts these fields before raw data reaches analysts or public dashboards.
  • Strict Role-Based Access Control (RBAC): Assign precise permissions across your entire operational team. Enumerators can only submit data for their assigned clusters, supervisors review specific geographic teams, and analysts work strictly with de-identified datasets.

Protect Your Respondents, Protect Your Mission

Trust is the foundation of effective field research. When respondents know their personal information is completely secure, they share far more accurate, honest, and reliable insights.

Don't let legacy security vulnerabilities compromise your organization's mission, beneficiary trust, or donor compliance.

Visit KAPsurvey today to learn how our secure, enterprise-grade research platform protects your data from the field tablet to the final report.

Read more→
How to Catch Survey Fraud Before It Ruins Your Research

How to Catch Survey Fraud Before It Ruins Your Research

You just completed a massive, month-long data collection exercise. Your dashboard shows 5,000 submitted household surveys. The grant requirements are met, and your team is ready to start analyzing the results.

But when your data scientists actually look at the raw data, a sinking feeling sets in.

Dozens of 45-minute surveys were completed in under five minutes. Hundreds of GPS coordinates are stacked exactly on top of each other—meaning the enumerator likely sat under a tree and filled out the forms themselves. Entire sections of multiple-choice questions feature the exact same "Choice A" answer all the way down.

Welcome to the costly world of "Ghost Data."

If your organization is waiting until the data cleaning phase to check for survey fraud, you are already too late. Here is why bad data slips through the cracks, and how modern organizations are stopping it at the source.

The Cost of the Honor System

Field enumerators have an incredibly difficult job. They work long hours in extreme weather, navigating difficult terrain and dealing with respondent fatigue. Given these high-pressure conditions, the temptation to cut corners is high.

Most legacy survey tools operate on the honor system. They passively accept whatever data is typed into the tablet and push it to the server. By the time a data analyst discovers the anomalies weeks later, the field team has already demobilized. You cannot send them back out to redo the work, leaving your organization with two terrible options:

  1. Throw out the fraudulent data and fail to meet your sample size requirements.
  2. Keep the bad data and compromise the integrity of your entire multi-million dollar program.

Moving from Reactive to Proactive Quality Control

To protect your research, you have to stop catching fraud after it happens and start preventing it while it is happening.

This requires upgrading from passive form builders to active data collection ecosystems like KAPsurvey. The platform acts as a digital supervisor, running silent quality assurance checks on every single submission before it ever reaches your database.

Here is how intelligent software eliminates Ghost Data:

  • Silent Metadata Tracking: KAPsurvey automatically captures background metadata without disrupting the interview. It tracks the exact GPS location of the device, the time spent on every individual question, and the total duration of the survey. If a 30-minute survey is completed in 3 minutes, the platform instantly flags the submission for review.
  • Sensor and Audio Audits: To ensure genuine interactions, project managers can enable random audio audits. The app will silently record 10-second audio snippets during specific questions, allowing headquarters to verify that a real conversation is taking place in the correct local language.
  • Automated Logic Fences: You can build strict validation rules directly into your questionnaire. If an enumerator inputs that a respondent is a 12-year-old male, but later selects that they have given birth to two children, the app will freeze and force the enumerator to correct the impossible data before moving forward.

Trust, but Verify

You hire field teams to collect reality, not to generate fiction.

By automating your quality control, you protect your enumerators from unfair accusations, protect your analysts from weeks of manual data cleaning, and protect your donors' investments.

Don't let Ghost Data haunt your next impact report. Visit KAPsurvey to learn how you can lock down your data quality from the very first tap on the screen.

Read more→
How to Track Behavior Change Over Time Without Spreadsheet Chaos

How to Track Behavior Change Over Time Without Spreadsheet Chaos

Category: M&E Best Practices | Target Audience: Program Directors, M&E Leads, and Data Analysts

In the world of Monitoring and Evaluation (M&E), a one-off survey rarely tells the whole story. Whether you are tracking maternal health outcomes over a three-year grant cycle or measuring the adoption of sustainable farming practices season after season, measuring real impact requires tracking change over time.

This requires longitudinal studies—returning to the exact same households, clinics, or communities at the baseline, midline, and endline of a project. While the methodology is the gold standard for proving impact, the execution is often a logistical nightmare.

If your organization is relying on generic form builders or basic data collection apps, you are likely trapped in a cycle of administrative chaos. This guide breaks down the common pitfalls of multi-year tracking and how to resolve them using relational data systems.

The Disconnected Data Problem

General-purpose survey tools are built for single events. They treat every single submission as an isolated, independent row of data.

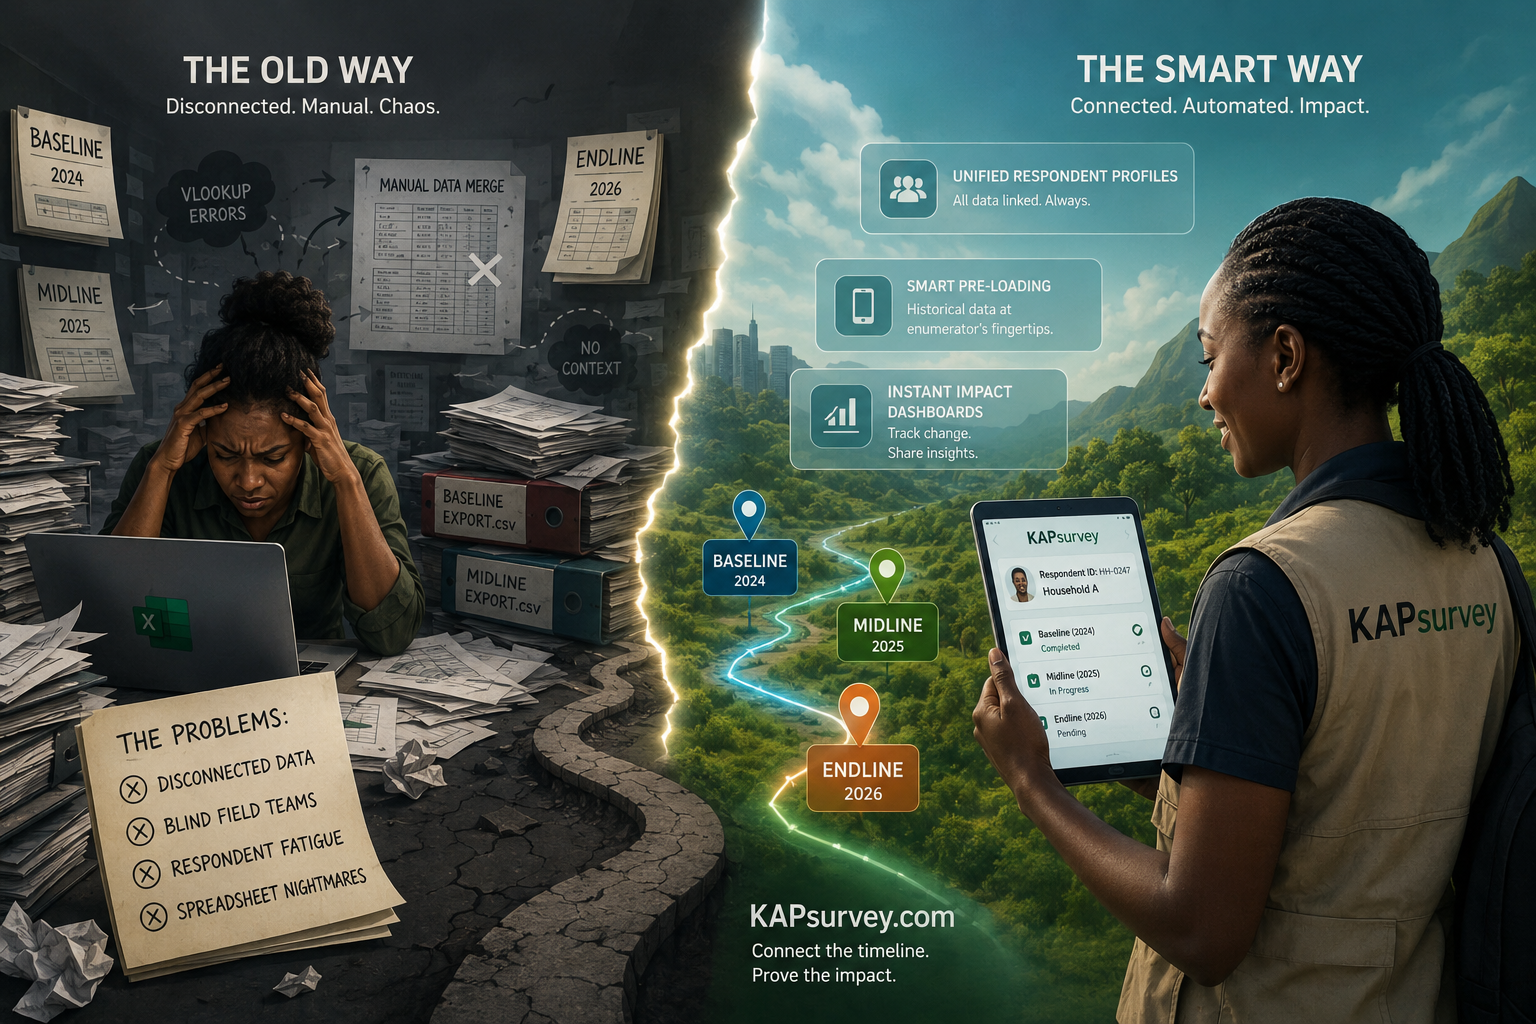
However, in longitudinal research, data is highly relational. The answers given by "Household A" in 2024 need to be directly compared to the answers given by "Household A" in 2026. When teams force relational research into basic tools, three critical operational failures occur:

1. The VLOOKUP Disaster

Because generic tools do not link records, data analysts are forced to export massive CSV files from different years and manually stitch them together in Excel using complex formulas and respondent IDs. If an enumerator misspells a name or transposes an ID number during a midline survey, the data link breaks entirely, resulting in lost data and weeks of manual cleaning.

2. Blind Field Teams

When enumerators return to a community for a midline assessment, they usually have no idea what the respondent said during the baseline. To track progress accurately, field teams need secure access to historical data right on their mobile devices so they can ask intelligent, follow-up questions rather than starting from scratch.

3. Respondent Fatigue

If you cannot seamlessly pull baseline data into your midline survey, enumerators are forced to ask the respondent the exact same demographic and screening questions year after year. This disrespects the respondent's time and leads to fatigue, rushed answers, and degraded data quality.

Best Practices: Connecting the Timeline

To execute a multi-year evaluation without drowning in data administration, organizations must upgrade to a system that natively understands relational data.

This is why complex research programs standardize their operations on the KAPsurvey Platform. Instead of generating isolated forms, the platform acts as a unified case management and assessment ecosystem.

Here is how modernizing your infrastructure secures your longitudinal data:

  • Unified Respondent Profiles: With KAPsurvey, every beneficiary, household, or facility has a secure, central profile. Baseline, midline, and endline assessments are automatically linked to that profile. Analysts never have to stitch together a broken spreadsheet again; the platform instantly calculates and displays the delta between Year 1 and Year 3.
  • Smart Pre-loading for the Field: Project managers can securely push historical baseline data directly to the enumerator's mobile app. When a field worker visits a clinic in 2026, the tablet automatically recalls the clinic's 2024 equipment shortages, allowing the enumerator to verify updates seamlessly—even in total offline dead zones.
  • Instant Impact Dashboards: Because the data is linked from the moment it is collected, the KAPsurvey built-in analytics engine can map trendlines automatically. Program directors can watch behavior change happen on live dashboards and share those real-time insights with donors instantly, proving ROI faster.

Stop Stitching, Start Tracking

If your data team is spending weeks manually cleaning and linking data across multiple years, your technology is holding back your mission. Longitudinal research requires enterprise-grade infrastructure.

It is time to equip your team with tools that connect the dots automatically. Visit KAPsurvey today to learn how you can track real, long-term behavior change without the administrative nightmare, and ensure your next multi-year grant is a success.

Read more→
How Smart Logic is Saving Field Research

How Smart Logic is Saving Field Research

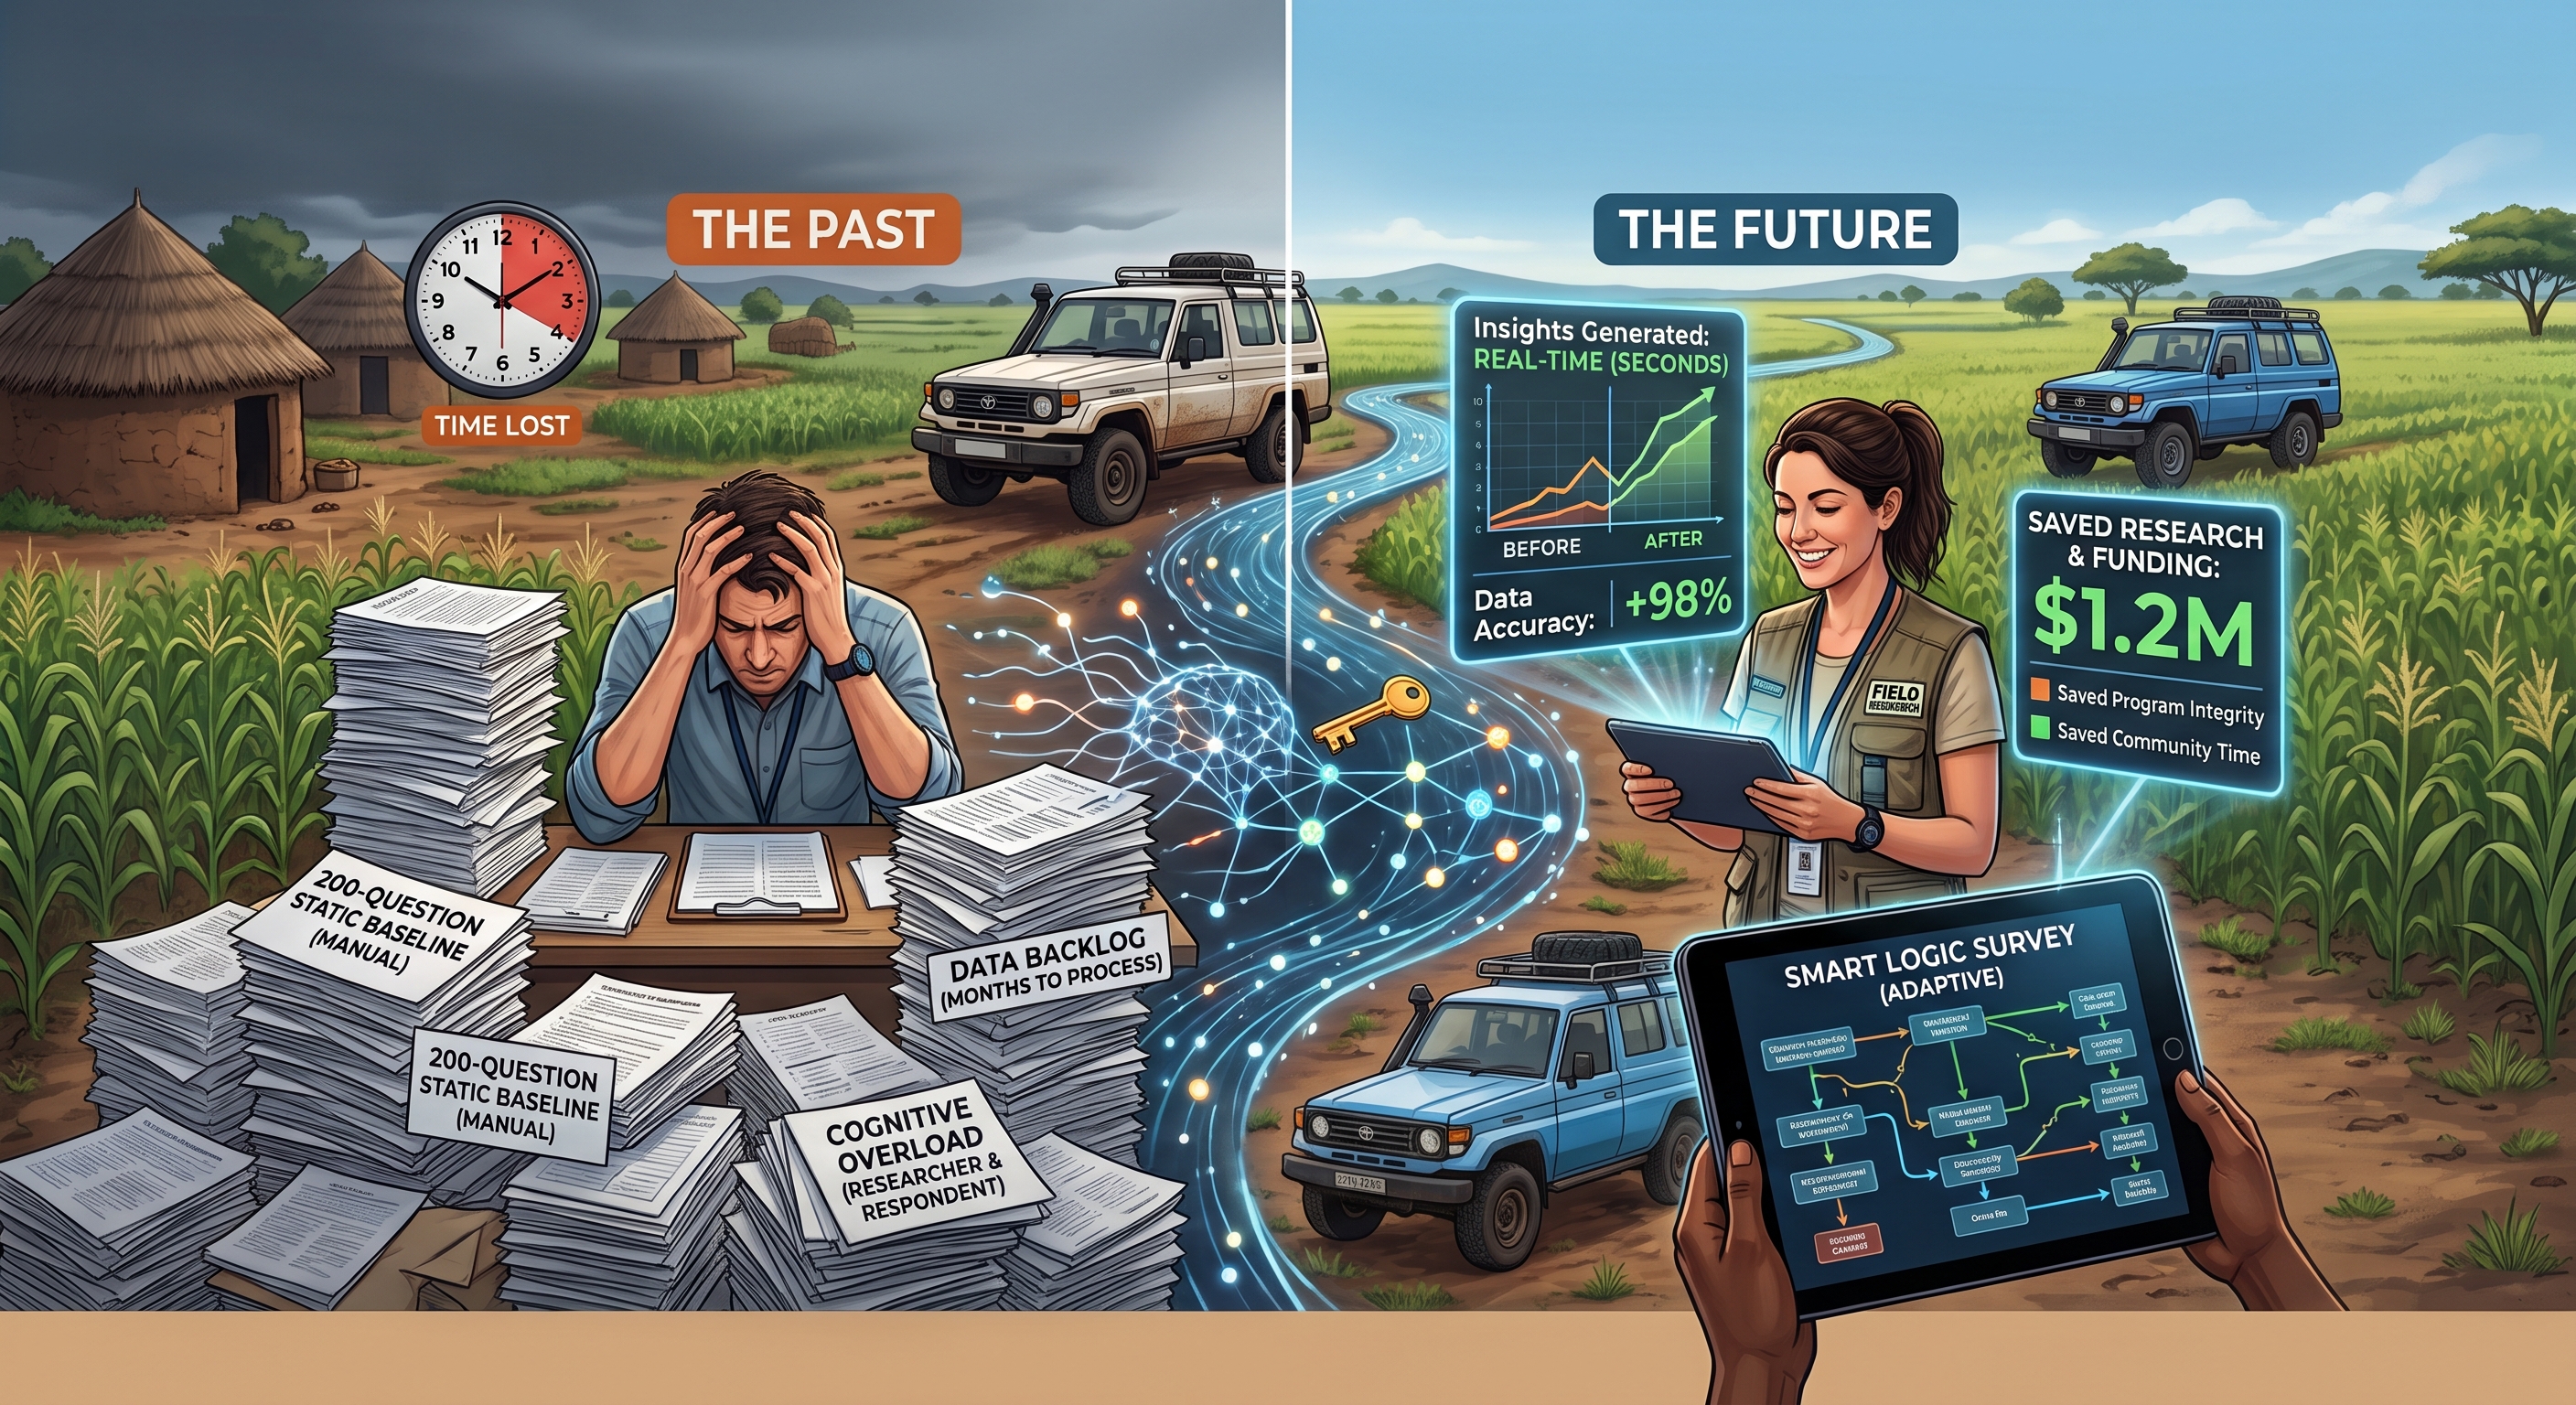
We have all seen it. A field team arrives in a community armed with a comprehensive, exhaustive baseline survey. It covers everything from household demographics to agricultural yields to complex behavioral attitudes.

It also takes two hours to complete.

By question 45, the respondent is exhausted. They have a farm to tend to, children to feed, or a business to run. To speed up the process, they stop giving thoughtful answers and just start agreeing with whatever the enumerator says. This phenomenon—respondent fatigue—is one of the biggest threats to data integrity in the global development sector.

Organizations often blame the length of the survey on strict donor requirements. But the truth is, the survey is usually too long because the technology being used to deploy it is too simple.

Here is why your surveys are longer than they need to be, and how modern platforms are solving the problem.

The Flaw of Linear Form Builders

When research teams use basic, generic form builders, they are forced to design highly linear, rigid questionnaires.

Because generic tools struggle to handle complex branching, enumerators are often forced to read through sections that do not even apply to the respondent. If a farmer says they do not grow maize, but the software lacks the capability to automatically skip the next 15 questions about maize fertilizer, the enumerator has to manually scroll past them—wasting time and breaking the conversational flow.

Furthermore, basic tools treat every survey as an isolated event. If you are conducting a midline study, generic tools cannot remember the answers the respondent gave last year. This forces the enumerator to ask the exact same tedious demographic questions all over again.

Designing Smarter, Not Longer

In 2026, the goal should not be to ask more questions. The goal should be to ask the right questions, dynamically, based on the context of the interview.

This is the engineering philosophy behind the KAPsurvey platform. By upgrading from a generic form builder to a specialized research ecosystem, M&E teams can drastically cut interview times without sacrificing data depth.

Here is how smart technology reduces respondent fatigue:

1. Ironclad Skip Logic

With KAPsurvey’s advanced form builder, researchers can bake highly complex, nested skip logic directly into the instrument. If a respondent answers "No" to a screening question, whole sections of the survey instantly disappear from the enumerator's screen. The software automatically hides irrelevant questions, ensuring the interview remains fast, focused, and conversational.

2. Pre-Loaded Historical Data

Because KAPsurvey functions as a unified relational database, project managers can push historical baseline data directly to the KAPsurvey Mobile app before the enumerator deploys. When an enumerator visits a household, the tablet already knows the household size and demographics from last year. The enumerator can simply verify the information rather than asking it from scratch, cutting interview times in half.

3. Smart Piping and Calculation

Modern tools can use the respondent's previous answers to dynamically change future questions. If a mother mentions she has two children, the software can automatically "pipe" that number into the next question, or calculate a specific household vulnerability score on the fly. This level of personalization makes the respondent feel heard and respected.

Respect the Community, Improve the Data

Your respondents are giving you their most valuable asset: their time. If you deploy your teams with rigid, repetitive software, you are disrespecting that time and actively harming your own data quality.

By adopting a smart, logic-driven platform, you can design shorter surveys that yield vastly superior insights. It is time to retire the 200-question spreadsheet.

Visit kapsurvey.com today to see how our advanced form builder can help you capture better data in half the time.

Read more→
Reaching Hard-to-Access Populations on WhatsApp and SMS

Reaching Hard-to-Access Populations on WhatsApp and SMS

For years, research directors have watched their response rates slowly plummet.

If you are trying to conduct a baseline assessment, gather community feedback, or run a longitudinal study, sending a generic web link via email is practically a guarantee of low engagement. In 2026, people simply do not respond to email surveys the way they used to, and deploying in-person enumerators for every single follow-up is financially impossible for most program budgets.

The populations you need to reach, whether they are urban youth, remote healthcare workers, or displaced communities, are communicating differently. They are on WhatsApp, Telegram, Viber, and SMS.

To get accurate, high-volume data, your research methodology must adapt to these channels. Here is how leading M&E (Monitoring and Evaluation) teams are modernizing their outreach and unifying their data collection across every messaging platform simultaneously.

The Multi-Channel Chaos Problem

Recognizing the shift to mobile messaging is easy. Executing it is the hard part.

When organizations try to run assessments across multiple channels, they usually run into a massive administrative wall.

If a project manager decides to use an SMS blasting tool for rural areas, a WhatsApp bot for urban centers, and offline tablets for deep-field clinics, they have just created three entirely separate data silos. At the end of the month, a data analyst has to export three different CSV files, manually align the columns, and scrub the formatting errors before they can even begin to look for programmatic insights.

This fragmented approach destroys data integrity and wastes weeks of valuable time.

8 Channels, 1 Unified Dashboard

You should not have to choose between reaching your target audience and maintaining a clean dataset.

This is the exact operational hurdle that KAPsurvey was engineered to solve. It is built on the principle that the channel of delivery should never complicate the analysis of the data.

With enterprise-grade infrastructure, project directors can manage their entire outreach strategy from a single, unified command center.

1. The Omnichannel Composer

Instead of juggling subscriptions to five different messaging platforms, researchers can build their assessment once in the KAPsurvey builder. From that single interface, they can distribute the exact same questionnaire via Email, SMS, WhatsApp, Telegram, Viber, QR Code, or an open Web Link.

If a respondent does not have a smartphone, they receive a simple, automated SMS flow. If they are in a region where Telegram is the primary communication tool, the survey meets them there securely.

2. Automated Campaign Management

Following up with respondents manually is tedious and prone to human error. Using KAPsurvey's Audience CRM, program teams can set up automated, multi-channel campaigns.

You can schedule your midline survey to send automatically, configure smart reminders for non-respondents, and track delivery rates channel-by-channel without lifting a finger. The outreach runs itself, freeing your team to focus on the results.

3. Instantly Standardized Data

The most powerful advantage of a unified platform happens after the respondent hits "submit."

Whether an answer was texted from a flip phone in a rural village, submitted via a WhatsApp chat in a capital city, or logged completely offline by an enumerator with the KAPsurvey Mobile app, it all lands in the exact same format.

The data is instantly standardized and fed into your live KAPsurvey analytics dashboards. There is no manual stitching, no data cleaning delay, and no corrupted spreadsheets. You get an immediate, real-time view of your project's impact across all demographics.

Meet Your Audience Where They Are

Your research is only as good as your response rate. If you are still relying on legacy email blasts and disconnected tools, you are missing the voices that matter most to your project's success.

It is time to make data collection conversational, accessible, and automated. Visit kapsurvey.com today to explore our multi-channel distribution tools and launch your first automated campaign.

Read more→
Why Your Field Data is Being Ignored by Decision-Makers

Why Your Field Data is Being Ignored by Decision-Makers

Picture this: Your team has just spent six months designing a rigorous field assessment, deploying enumerators to remote regions, and meticulously cleaning the data. Your analysts spent another three weeks crunching the numbers to produce a comprehensive, 150-page PDF impact report.

You send it to your donors, government partners, and board of directors.

The harsh reality? Most of them will only read the executive summary. If a specific metric isn’t on page one, it might as well not exist. By the time the report lands on their desks, the reality on the ground has often already shifted.

We call this the Dashboard Divide - the massive gap between the rich, nuanced data collected in the field and the static, outdated formats used to communicate it to decision-makers. If your organization is still relying on static PDFs and PowerPoint decks to prove impact, you are underselling your hard work.

Here is why traditional reporting is failing, and how modern organizations are using purpose-built platforms to bridge the divide.

The Problem with the "PDF Autopsy"

The traditional reporting cycle treats data as a post-mortem. Data is collected, locked in a spreadsheet, analyzed in isolation, and eventually published as a static document.

This workflow creates three major bottlenecks for program directors and stakeholders:

1. The Data is Stale on Arrival

In the fast-paced world of global development and public health, waiting two months for a final report is unacceptable. If a donor wants to know how a specific demographic is responding to an intervention today, a PDF from last quarter doesn't help them. Decision-makers need to see trends as they emerge, not just after the project has ended.

2. Zero Interactivity

When a ministry official or board member reads a static report, they inevitably have follow-up questions. "What if we break this metric down by rural versus urban clinics?" In a traditional setup, answering that question requires the data analyst to open the raw files, run a new query, and email back a new chart three days later.

3. The "Black Box" of Trust

Donors are demanding more transparency than ever before. When they are handed a highly polished, static report, they have no visibility into the actual data collection process. They cannot see the sample sizes update, and they cannot verify the chain of custody.

Bridging the Divide with KAPsurvey

To solve this, organizations must stop treating "data collection" and "stakeholder communication" as two separate phases. They need to happen simultaneously.

This is exactly the problem kapsurvey.com was built to solve. By functioning as an end-to-end ecosystem, it completely bypasses the traditional reporting bottleneck.

Here is how modern research teams are using specialized technology to keep decision-makers engaged:

  • From Static to Live: Because data collected via the KAPsurvey mobile app syncs securely to the cloud, the platform's built-in analytics engine updates in real time. Program directors no longer have to wait for a final report; they can watch the data populate live dashboards day by day.
  • Shareable, Secure Insights: Instead of emailing heavy, unsecure spreadsheets or static PDFs, project managers can generate secure, read-only dashboard links directly from kapsurvey.com. Donors can click the link and explore the data themselves, hovering over charts and filtering by region without ever accessing the raw, sensitive respondent data.
  • Automated Indicator Scoring: The platform automatically calculates complex programmatic indicators as the data arrives. If a stakeholder wants to know the aggregate "Attitude Score" of a specific community, it is already calculated and visualized on their dashboard.

Make Your Data Speak

Your field enumerators and data analysts work too hard for their insights to be trapped in an unread document.

In 2026, transparency and speed are competitive advantages. By giving your stakeholders a window directly into the data, you build trust, secure future funding, and empower your team to make agile, data-driven decisions.

It is time to cross the dashboard divide. Visit kapsurvey.com today to learn how you can turn your next field assessment into a live, interactive experience for your stakeholders.

Read more→
Why Tracking Behavior Change is Breaking Your Spreadsheets

Why Tracking Behavior Change is Breaking Your Spreadsheets

In the world of Monitoring and Evaluation (M&E), a one-off survey rarely tells the whole story. Real impact is not a snapshot; it is a movie.

Whether you are tracking maternal health outcomes over a three-year grant cycle or measuring the adoption of sustainable farming practices season after season, organizations need to measure change over time. This requires longitudinal studies—returning to the same households, clinics, or communities at the baseline, midline, and endline of a project.

The methodology makes perfect sense. The execution, however, is often a logistical nightmare.

If your organization is relying on generic form builders or basic data collection apps to run longitudinal assessments, you are likely trapped in a cycle of spreadsheet chaos. Here is why tracking behavior change over time breaks standard tools, and how modern platforms are solving the puzzle.

The Disconnected Data Problem

General-purpose survey tools are built for single events: a customer feedback form, an event registration, or a one-time poll. They treat every single submission as an isolated, independent row of data.

But in longitudinal research, data is highly relational. The answers given by "Household A" in 2024 need to be directly compared to the answers given by "Household A" in 2026. When you try to force this relational research into basic tools, three things go wrong:

1. The VLOOKUP Disaster

Because generic tools don't link records, data analysts are forced to export massive CSV files from different years and manually stitch them together in Excel using complex formulas and respondent IDs. If an enumerator misspelled a name or transposed an ID number during the midline survey, the data link breaks entirely.

2. Blind Field Teams

When enumerators return to a community for a midline assessment, they usually have no idea what the respondent said during the baseline. They are flying blind. To track progress accurately, field teams need secure access to historical data right on their mobile devices so they can ask intelligent, follow-up questions.

3. Respondent Fatigue

If you cannot seamlessly pull baseline data into your midline survey, you are forced to ask the respondent the exact same demographic and screening questions year after year. This leads to respondent fatigue, rushed answers, and degraded data quality.

Connecting the Timeline with KAPsurvey

To execute a multi-year evaluation without drowning in data administration, organizations must upgrade to a system that understands relational data.

This is why complex research programs rely on KAPsurvey.com. Instead of generating isolated forms, the platform acts as a unified case management and assessment ecosystem.

Here is how specialized technology transforms longitudinal studies:

  • Unified Respondent Profiles: With KAPsurvey.com, every beneficiary, household, or facility has a secure, central profile. Baseline, midline, and endline assessments are automatically linked to that profile. Your analysts never have to stitch together a broken spreadsheet again; the platform instantly shows the delta between Year 1 and Year 3.
  • Smart Pre-loading for the Field: Project managers can securely push historical baseline data directly to the enumerator's KAPsurvey Mobile app. When a field worker visits a clinic in 2026, the tablet automatically recalls the clinic's 2024 equipment shortages, allowing the enumerator to verify updates seamlessly—even in total offline dead zones.
  • Instant Impact Dashboards: Because the data is linked from the moment it is collected, the platform's built-in analytics engine can map trendlines automatically. You can watch behavior change happen on live dashboards and share those real-time insights with donors instantly.

Stop Stitching, Start Tracking

If your team is spending weeks manually cleaning and linking data across multiple years, your technology is holding back your mission.

Longitudinal research is the gold standard for proving impact, but it requires enterprise-grade infrastructure. It is time to equip your team with tools that connect the dots automatically. Visit KAPsurvey.com today to learn how you can track real, long-term behavior change without the administrative nightmare.

Read more→
The Blueprint for Flawless Field Data: How to Standardize Your Next Assessment

The Blueprint for Flawless Field Data: How to Standardize Your Next Assessment

We have all been there. You spend months locked in a room with your research committee, debating the perfect methodology, calculating sample sizes, and designing an airtight study.

But the moment your team actually hits the ground, the chaos begins.

One field team is using an outdated version of the survey. Another team is stuck in a dead zone with a crashed app, losing a full day's worth of interviews. Meanwhile, your data analysts are staring at a massive, messy spreadsheet, realizing they are going to spend the next three weeks just cleaning formatting errors before they can even run a single metric.

When executing any large-scale behavioral, social, or operational assessment, inconsistency is the enemy of good data. If your baseline and endline teams are following different protocols, your data integrity suffers immediately.

That is why the most successful research teams don't just rely on good science—they rely on rock-solid Standard Operating Procedures (SOPs) powered by specialized tech. Here is the exact blueprint for taking your next study from a theoretical concept to a flawless execution using purpose-built tools.

Phase 1: Structuring the Science

Before a single tablet is charged, your team needs absolute alignment. Moving too fast here is the leading cause of messy data later on.

First, your team must finalize the core research framework. This means explicitly mapping out exactly which indicators and variables are being measured so they align perfectly with your overall study goals.

Once the theory is locked, finalize your evaluation design (such as cross-sectional versus longitudinal) and calculate your target demographics. Your lead statistician must clearly define the sampling strategy and target quotas so that your project managers know exactly what to track once the field teams deploy.

Phase 2: Building an Ironclad Instrument

Translating your scientific framework into a field-ready digital questionnaire is where generic form builders usually fall apart.

Complex field assessments require intense skip logic, validation constraints, and randomization. If you try to force advanced assessment questions into a basic survey app, the logic will break, enumerators will get confused, and your data will be corrupted.

This is why upgrading to purpose-built KAPsurvey Software is a game-changer. By utilizing the dedicated KAPsurvey Design builder available at kapsurvey.com, your data managers can build research-grade logic that prevents bad data from ever being entered in the first place. You can restrict age limits, force mandatory fields, and ensure complex routing works flawlessly.

Phase 3: Field Deployment (The Offline Reality)

The moment of truth is the field implementation phase. Your enumerators are out in the community, and chances are, they don't have a reliable internet connection.

If your field app requires constant cloud access to save data, your study is at serious risk. To ensure flawless collection, your IT team needs to equip enumerators with a true offline-first application.

By installing KAPsurvey Mobile on your field tablets, your enumerators can operate with complete confidence. A dedicated KAP Survey Mobile app automatically caches all records locally when connectivity drops, meaning your team experiences zero data loss in remote areas. The second they drive back into a cell zone, everything syncs securely to the cloud.

Phase 4: Syncing and Automated Reporting

The final phase is where traditional teams lose the most time. If you are treating data collection and data analysis as two separate phases, you are moving too slowly.

With modern systems, the two happen simultaneously. As your field teams sync their devices daily, project managers can log into the central KAPsurvey Platform to track live sampling quotas, instantly identifying if a specific region is falling behind.

Even better? The "data cleaning" delay is completely eliminated. Because you used strict validation rules during the design phase, the platform’s built-in analytics engine can instantly calculate your complex indicator scores the moment the data hits the server. Instead of emailing messy CSV files, program directors can generate secure, read-only dashboard links directly from kapsurvey.com to share real-time findings with donors and stakeholders.

Ready to standardize your operations? Stop relying on fragmented tools, generic survey apps, and broken spreadsheets. It is time to treat your field operations with the same rigor as your scientific methodology. Visit kapsurvey.com today to see how a purpose-built platform can transform your next assessment.

Read more→
Why Everyone is Upgrading Their Data Collection Tools

Why Everyone is Upgrading Their Data Collection Tools

The demand for modern data collection and analytics platforms is surging as organizations scramble to modernize their tech stacks. Between AI-powered dashboards, offline field apps, and no-code survey builders, teams of every size are actively evaluating which tools actually fit how they work.

This post looks at what's driving this massive software evaluation cycle, the categories of tools people are comparing today, and where a specialized platform like KAPsurvey.com fits for teams running structured research.

What makes KAPsurvey different? Rather than just acting as a digital clipboard, KAPsurvey is built to be both a data collection tool and a communication tool. It bridges the gap between gathering rigorous field data and seamlessly sharing those insights with stakeholders, donors, and implementation teams in real time.

Why Upgrading Data Tools is a Board-Level Priority

Data has become the top priority for nearly every organization, but the legacy tools people rely on to gather it are struggling to keep pace. The relentless push for enterprise digital transformation is forcing organizations to replace fragmented, manual data entry with unified platforms capable of handling data at scale.

The stakes for getting this right are massive. Poor data quality remains the leading obstacle to becoming a truly data-driven organization. The hidden costs of bad data, ranging from wasted hours spent cleaning spreadsheets to flawed strategic decisions, drain millions from operational budgets annually. According to Gartner, poor data quality costs organizations an average of $12.9 million per year. At the same time, recent industry reports indicate that a significant majority of organizations feel their data is not yet of sufficient quality to effectively implement AI.

The Compliance and Security Push

Adding to the complexity, upcoming regulations are redefining how organizations must handle respondent information. Frameworks like the EU's Artificial Intelligence Act, alongside stricter GDPR enforcement, are pushing organizations in healthcare, international development, and public health to think carefully about data residency. You can no longer afford to collect sensitive community data on a consumer-grade form builder whose servers sit in an undisclosed location.

What's Actually Trending in Data Collection and Analytics

When looking at the current landscape of tools and industry reports, a few clear patterns emerge that separate legacy software from modern platforms:

  • AI is Moving from Add-On to Default: Predictive analytics is shifting from specialized data science projects into everyday business workflows. Generative AI and real-time processing mean dashboards now summarize results automatically, allowing for natural-language queries and embedded assistants.
  • Offline and Field-Ready Capture Still Matters: Despite the AI wave, the reality of fieldwork hasn't changed. Many teams still need tools that work seamlessly without a stable internet connection. The most valuable platforms support robust local caching, allowing enumerators to collect hundreds of records offline and automatically sync them without data loss the moment a connection is established.
  • No-Code and Low-Code Integration is Standard: Platforms that offer no-code or low-code configuration are capturing high demand. Teams without dedicated data engineers need platforms that connect to their existing CRMs, BI tools, and data lakes right out of the box.
  • Governance Must Catch Up with Speed: Collecting fast isn't enough anymore. Data must serve both human readers and machine systems, meaning AI tools and analytics engines depend on clean, well-defined, and well-governed inputs.

The Hidden Cost of "General-Purpose" Tools

Most of what shows up in a broad search for "data collection software", such as general form builders, generic survey platforms, and CRM add-ons, is built for a wide range of use cases like customer feedback, lead capture, or event registration.

While that flexibility is great for a marketing team, it becomes a severe limitation for structured social science, public health, and large-scale field research.

When organizations attempt to force a KAP (Knowledge, Attitude, and Practices) assessment into a generic form builder, three things inevitably break:

  1. Complex Logic Fails: KAP studies require advanced skip logic, randomized question blocks, and weighted scoring. Generic tools often limit you to basic "If A, then B" branching, forcing researchers to split surveys into confusing, fragmented pieces.
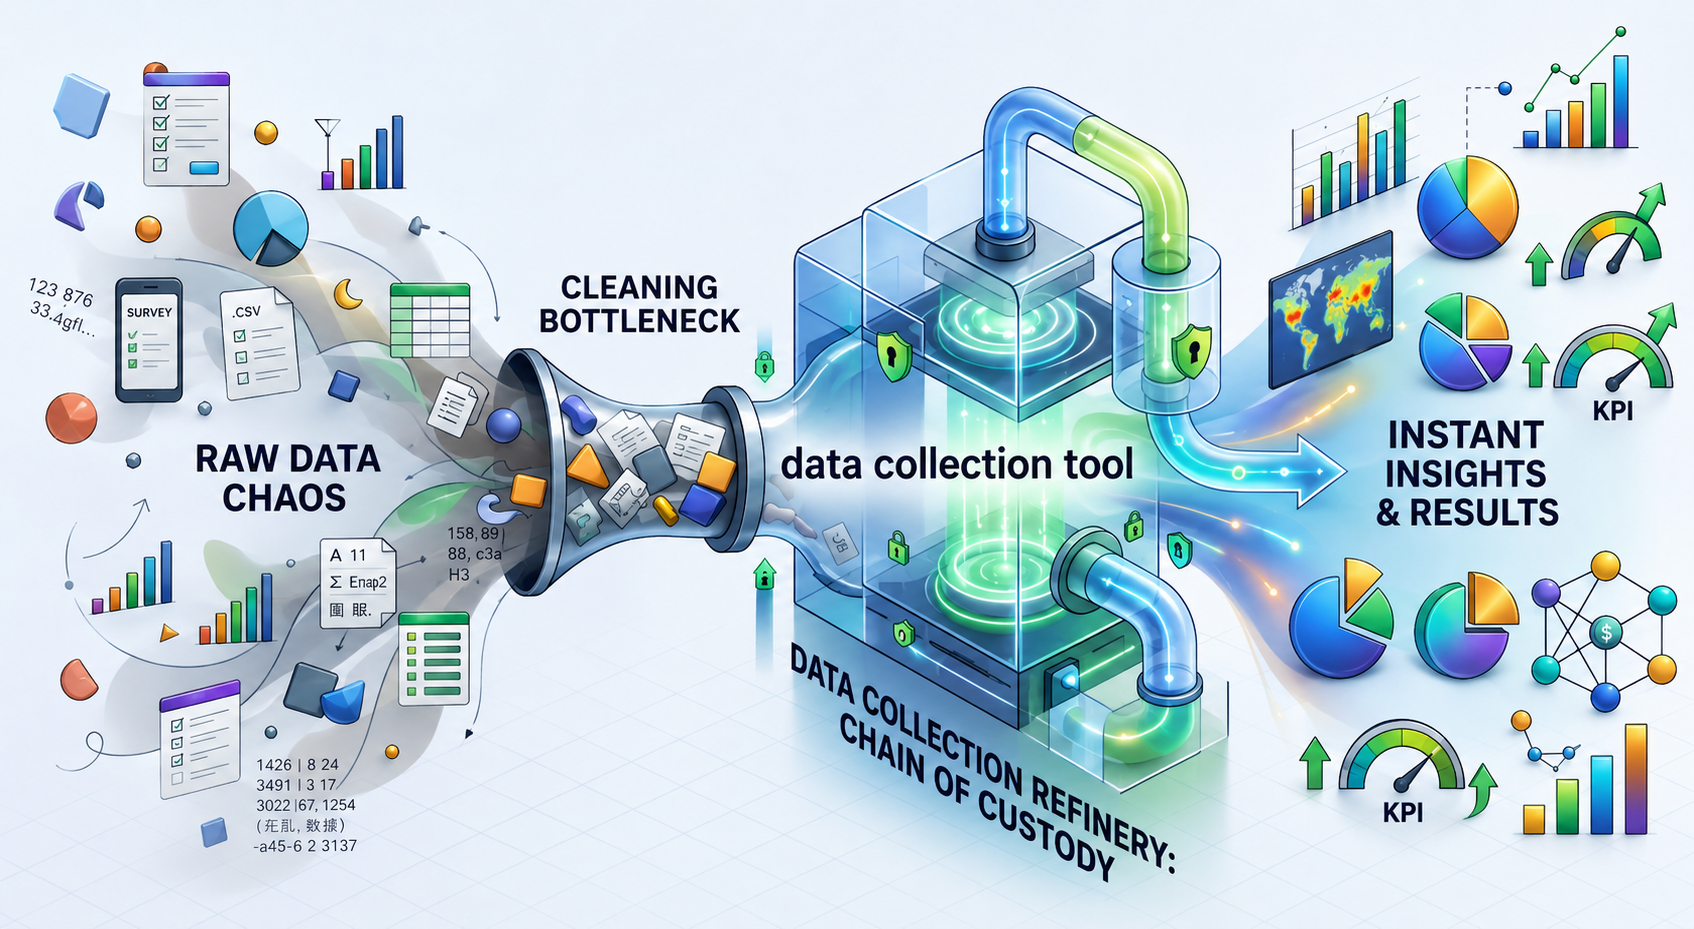
  2. Data Cleaning Becomes a Nightmare: Because generic tools lack strict, research-grade validation rules, field workers can easily submit incomplete or poorly formatted data. Analysts then spend weeks cleaning the data before it can even be visualized.
  3. Longitudinal Tracking is Impossible: Measuring behavior change over time requires linking baseline, midline, and endline data. General form builders treat every submission as an isolated event, making it incredibly difficult to track community progress across multiple years.

Where KAPsurvey Fits: Purpose-Built for Field Research and Reporting

KAPsurvey.com applies modern expectations, offline-ready capture, clean data pipelines, and built-in analytics, to the specific structure a rigorous field assessment requires. By functioning as both a data collection tool and a communication tool, it ensures insights don't get trapped in a spreadsheet.

Standardized Field Collection

Rather than relying on generic drag-and-drop forms, the platform is designed around highly structured, validated field questionnaires. Field teams can deploy the exact same instrument across multiple sites, ensuring strict comparability whether the data is collected in a rural clinic or an urban center.

The offline-first architecture means enumerators can collect data in total dead zones. Built-in validation rules ensure bad entries, like typing a 3-digit age or skipping a mandatory demographic field, never make it into the dataset. This workflow scales seamlessly from a 50-person pilot to a multi-region rollout with thousands of respondents.

Automated Analytics & Seamless Communication

Once responses are in, the platform's analytics engine immediately turns raw field data into usable insights.

Instead of exporting CSV files to external visualization software, you get automatic cross-tabulations by demographic or region. Dashboards update in real time as field submissions sync to the cloud.

Most importantly, complex indicator scores and group metrics are calculated automatically. If you need to know the aggregate "Attitude" score of a specific demographic, the platform calculates it instantly, eliminating hours of manual crunching. Because KAPsurvey is designed as a communication tool, these live dashboards and tailored reports can be shared securely via read-only links directly with decision-makers, closing the gap between raw data collection and actionable communication.

How KAPsurvey Aligns the Entire Research Committee

When evaluating a purpose-built tool like KAPsurvey, it becomes clear that it's designed to solve the specific bottlenecks faced by every member of the project team, not just the field enumerators:

  • For the Field Enumerator: A lightweight, battery-efficient mobile interface that doesn't crash offline and clearly guides them through complex survey routing without requiring technical support.
  • For the Data Analyst: Clean, pre-structured data that flows directly into real-time dashboards, completely eliminating the "data cleaning phase" that usually delays reporting by weeks.
  • For the IT & Compliance Director: Enterprise-grade security, strict role-based access controls, and transparent data residency that satisfies donor audits and international privacy laws.
  • For the Program Director: Instantly shareable, high-level dashboards that clearly communicate project impact to donors, ministries, and stakeholders without requiring a degree in data science.

End-to-End Workflow Management

The platform supports the entire operational cycle, from questionnaire design to live deployment and reporting, all in one place. Built-in feedback loops let program teams revisit and communicate findings throughout implementation, not just at baseline and endline. Combined with role-based access and multi-language support, these tools remove technical friction so teams can focus on the research itself.

Choosing the Right Tool for the Job

The current wave of platform upgrades is really a search for two different things at once: broad tools for everyday feedback, and specialized tools built for rigorous, repeatable research and transparent reporting.

If your work involves sending a quick post-event survey to a mailing list, a general-purpose form builder is exactly what you need.

But if your work involves running complex assessments across communities, tracking behavior change over time, ensuring data integrity across offline environments, or clearly communicating results to donors and ministries, a general-purpose form builder will only get you partway there.

That's the space KAPsurvey.com is built for: bringing assessment design, offline field collection, and powerful communication features into a single platform so your team can move directly from a field question to a shared insight.


Read more→