In today's data-driven world, the ability to quickly understand and act on information is paramount. Yet, many professionals still find themselves bogged down by the tedious process of manual reporting, exporting raw data, wrestling with spreadsheets, and painstakingly building charts. The Insights tab is a powerful feature designed to eliminate this friction, transforming complex data into clear, actionable intelligence at a glance.
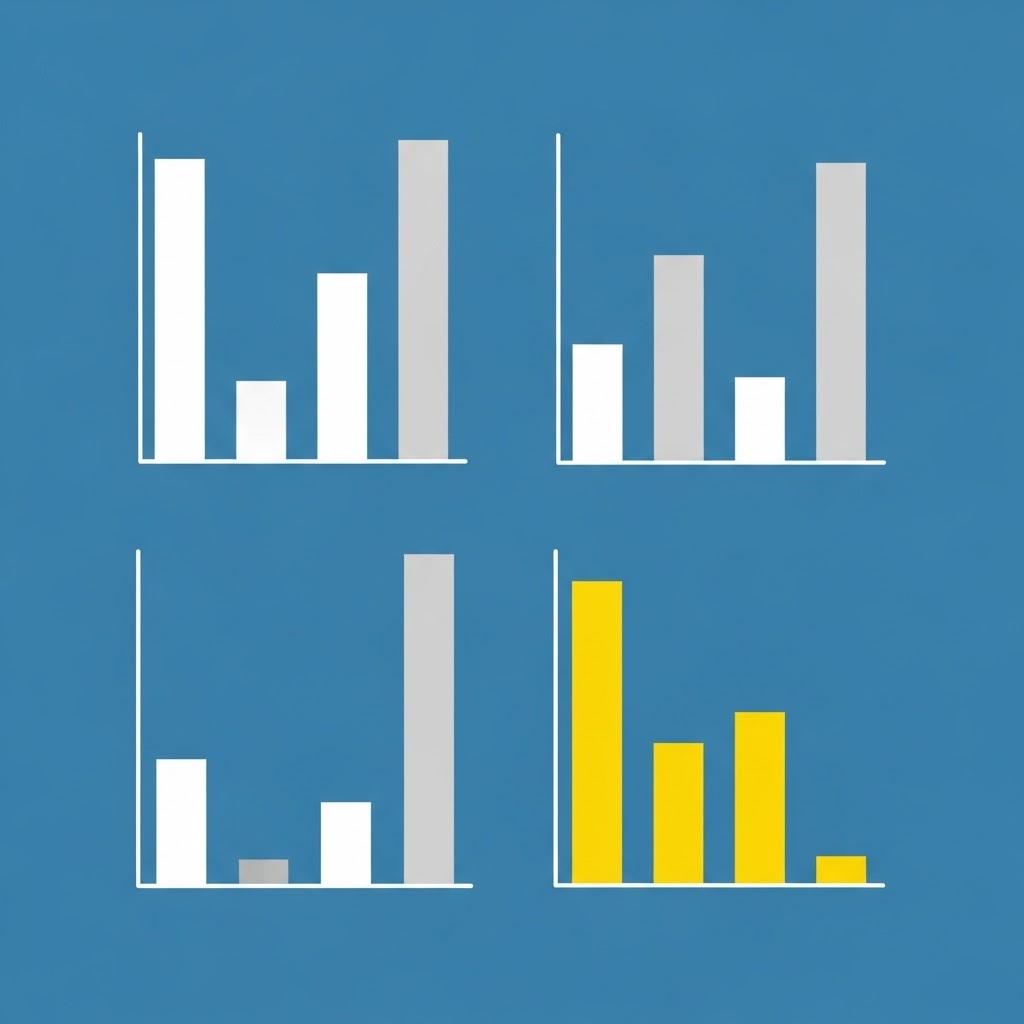
At its core, the Insights tab acts as a dynamic, visual command center for your most critical metrics. Instead of presenting you with rows of numbers, it automatically generates easy-to-understand graphs, charts, and key performance indicators (KPIs). This immediate visualization helps you spot trends, identify anomalies, and gauge performance without spending hours on manual analysis. It answers your most pressing questions; How are we performing this quarter? Which channels are driving the most growth? in a matter of seconds.
Your Data, Your Dashboard
One of the most powerful features of the Insights tab is its deep customizability. You're not limited to a one-size-fits-all view. The platform allows you to pin multiple graphs and data points that are most relevant to your goals, creating a personalized dashboard.
Imagine you're a marketing manager focused on campaign ROI, website traffic, and social media engagement. You can simply find the corresponding charts within the platform's analytics suite and pin each one to your main Insights view. This creates a single screen that displays all your essential data, tailored specifically to your role. There's no need to navigate through different menus or regenerate reports every time you need an update. Your custom dashboard provides a real-time snapshot, ensuring the information you need is always front and center.
Streamlining the Reporting Workflow
The benefits extend far beyond personal convenience. The Insights tab makes sharing information with stakeholders effortless. During a team meeting, you can pull up your dashboard to provide a live, data-backed overview of progress. The visual nature of the charts makes complex information digestible for everyone, regardless of their technical expertise.
By automating the heavy lifting of data visualization, the Insights tab frees up valuable time. Professionals can shift their focus from building reports to interpreting them, dedicating their energy to strategic decision-making that drives growth. It effectively closes the gap between raw data and actionable intelligence, making reporting less of a chore and more of a strategic advantage.
#Kapsurvey