You ran the survey. The responses are in. You open the results dashboard and — there it is: a satisfying array of bar charts, pie charts, and percentage breakdowns. 72% of respondents agreed. 54% selected option B. The average satisfaction score was 3.8 out of 5.
And then what?
For too many teams, survey data ends its journey as a slide deck. Executives nod, someone says "interesting," and the results file quietly into a shared drive, never to surface again. The survey was conducted. The data was collected. The charts were made.
But nothing actually changed.
The gap between survey results and business impact isn't a data problem it's an interpretation and action problem.
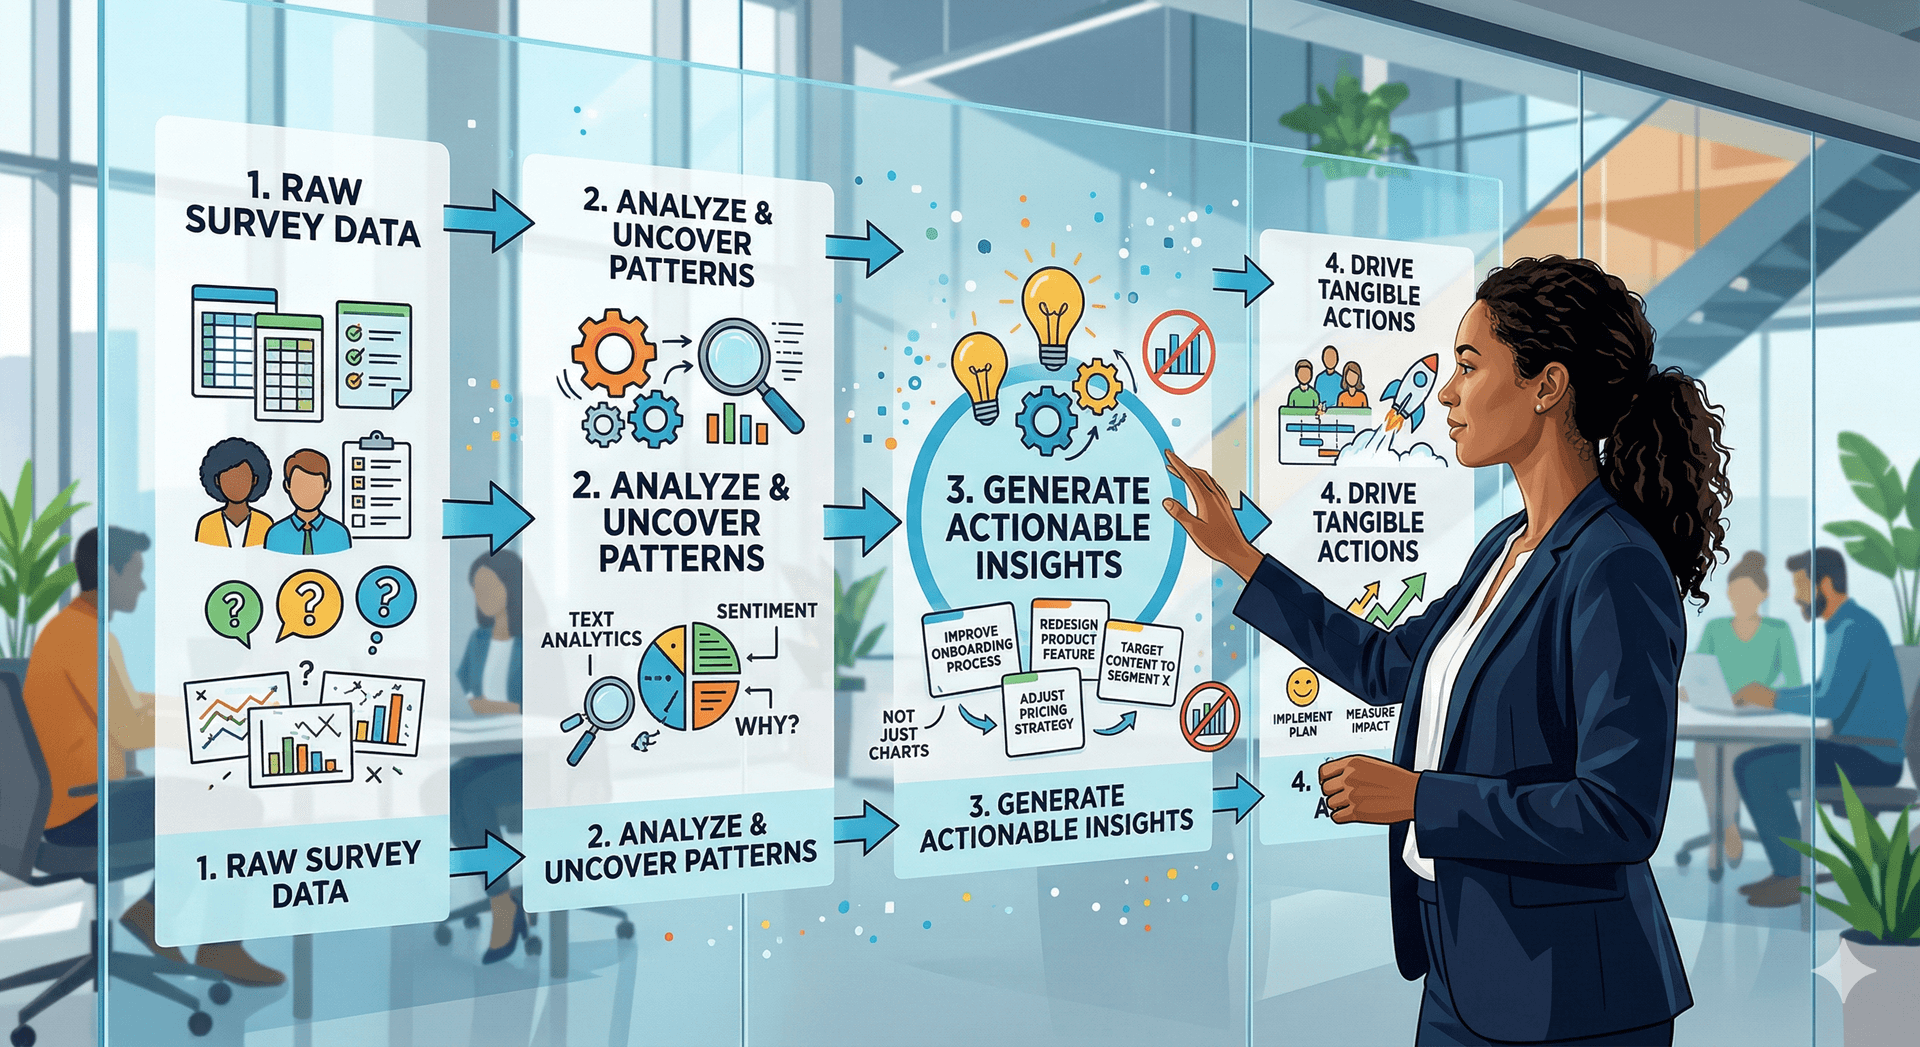
Turning survey data into actionable insights requires moving through four deliberate stages: cleaning and contextualizing your data, finding the signal in the noise, framing findings for decision-makers, and building a clear path to action.
1. Start Before You Analyze: Define What 'Actionable' Means
The most common reason survey data goes nowhere is that nobody defined success before the survey launched. What decision was this survey supposed to inform? What would you do differently depending on the results?
Before you touch the data, ask your team:
- What is the one decision this survey needs to support?
- Who has the authority to act on the findings?
- What threshold would trigger a meaningful response? (e.g., if satisfaction drops below X, we do Y)
If you can't answer these questions after the fact, you can still reverse-engineer intent. Go back to the survey questions and map each one to a possible outcome. A question about feature satisfaction should map to product roadmap decisions. A question about onboarding experience should connect to customer success workflows.
Without this mapping, insights float free of consequences — interesting, but inert.
2. Clean Your Data Like a Skeptic
Raw survey data is rarely clean. Before drawing any conclusions, audit your dataset with healthy suspicion.
Watch out for:
- Speeders — respondents who completed the survey in an implausibly short time
- Straight-liners — people who selected the same answer for every question in a grid
- Contradictory responses — e.g., claiming to be both highly satisfied and actively looking for alternatives
- Open-ended non-answers — gibberish, copy-pasted text, or responses that are clearly off-topic
Removing bad data isn't cherry-picking — it's quality control. A sample of 400 thoughtful responses is more useful than 600 that include 200 junk entries inflating your averages.
Also check for response bias. Who answered? If your survey went to existing customers, it won't reflect churned users. If it was voluntary, motivated respondents (very happy or very upset) are overrepresented. Always qualify your findings with who was and wasn't in the sample.
3. Move From Frequencies to Patterns
Here's where most analysis stops — and where it should actually begin. Reporting that "68% of users found the checkout process confusing" is a frequency. It tells you something happened. It doesn't tell you why, for whom, or what to do about it.
To find patterns, layer in segmentation and cross-tabulation.
Segment by behavior or context, not just demographics. Instead of comparing responses by age or gender, try:
- New users vs. long-term customers
- High-value accounts vs. low-value accounts
- Users who completed the task vs. those who didn't
- Respondents from different product tiers or regions
Segmentation often reveals that an average is hiding two very different stories. An overall satisfaction score of 3.8 might actually be 4.6 for power users and 2.9 for users on the free tier. Those aren't the same problem, and they don't have the same solution.
An average is often a lie. The moment you segment your data, the real story begins.
Cross-tabulation shows you relationships between variables. Did respondents who rated onboarding highly also report higher overall satisfaction? Did users who contacted support more than twice in their first month also score product value lower? These correlations are where insight lives.
For open-ended responses, resist the urge to quote the most colorful ones. Instead, code them thematically. Read through a sample, identify recurring themes, tag each response, and count the themes. Frequency beats anecdote.
4. Translate Data Into Decisions, Not Descriptions
The shift from "here's what respondents said" to "here's what we should do" is the hardest and most important one. It requires moving from reporter to analyst to advisor.
A useful framework: for every key finding, force yourself to complete these three sentences:
- We found that...
- This matters because ...
- Therefore, we recommend...
The first sentence is the data. The second connects it to business impact. The third is the action. If you can't complete all three, the finding probably isn't ready to present.
Be specific about recommendations. "Improve the onboarding experience" is not a recommendation it's a direction. "Redesign the welcome email sequence to address the top three confusion points identified in the survey, and A/B test against the current version over 60 days" is a recommendation.
Also, be honest about what the data can't tell you. Survey data captures stated preferences and perceptions not always behavior. People say they want X, but do they use X? Acknowledge the limits of your instrument, and recommend complementary research (usage data, interviews, A/B tests) where the stakes are high.
5. Present Findings for the Decision That Needs to Be Made
The final step is packaging your insights for the audience who has to act on them. This is where most researchers lose their stakeholders — by leading with methodology, burying the headline, or presenting every finding with equal weight.
Principles for presenting survey insights effectively:
- Lead with the implication, not the finding. Don't open with "72% of users said X." Open with "We have a retention risk among new users that this data makes impossible to ignore."
- Prioritize ruthlessly. Present three to five findings maximum. Every chart you add dilutes the ones that matter.
- Separate facts from interpretation. Be clear about what the data shows versus what you believe it means. Stakeholders can challenge an interpretation; they can't argue with a well-sourced figure.
- Make the ask explicit. End every presentation with a clear decision request: "We're recommending X. Do we have alignment to proceed?"
Visual aids should support the narrative, not replace it. A single chart that shows satisfaction dropping among users who never completed onboarding, with a clear caption and a bolded recommendation beneath it, is worth more than twenty slides of pie charts.
The Difference Between Data and Insight
Data describes what happened. Insight explains why it matters and what to do next. The distance between those two things isn't measured in charts or statistical significance — it's measured in thinking.
The teams that get the most value from surveys aren't the ones with the best tools or the largest sample sizes. They're the ones who define the decision first, treat the analysis as hypothesis-testing, and take personal ownership of the "so what."
Surveys are conversations at scale. Treat the results with the same curiosity and rigor you'd bring to a conversation with your most important customer — and then make sure someone in the room has the authority and the will to do something about what they said.