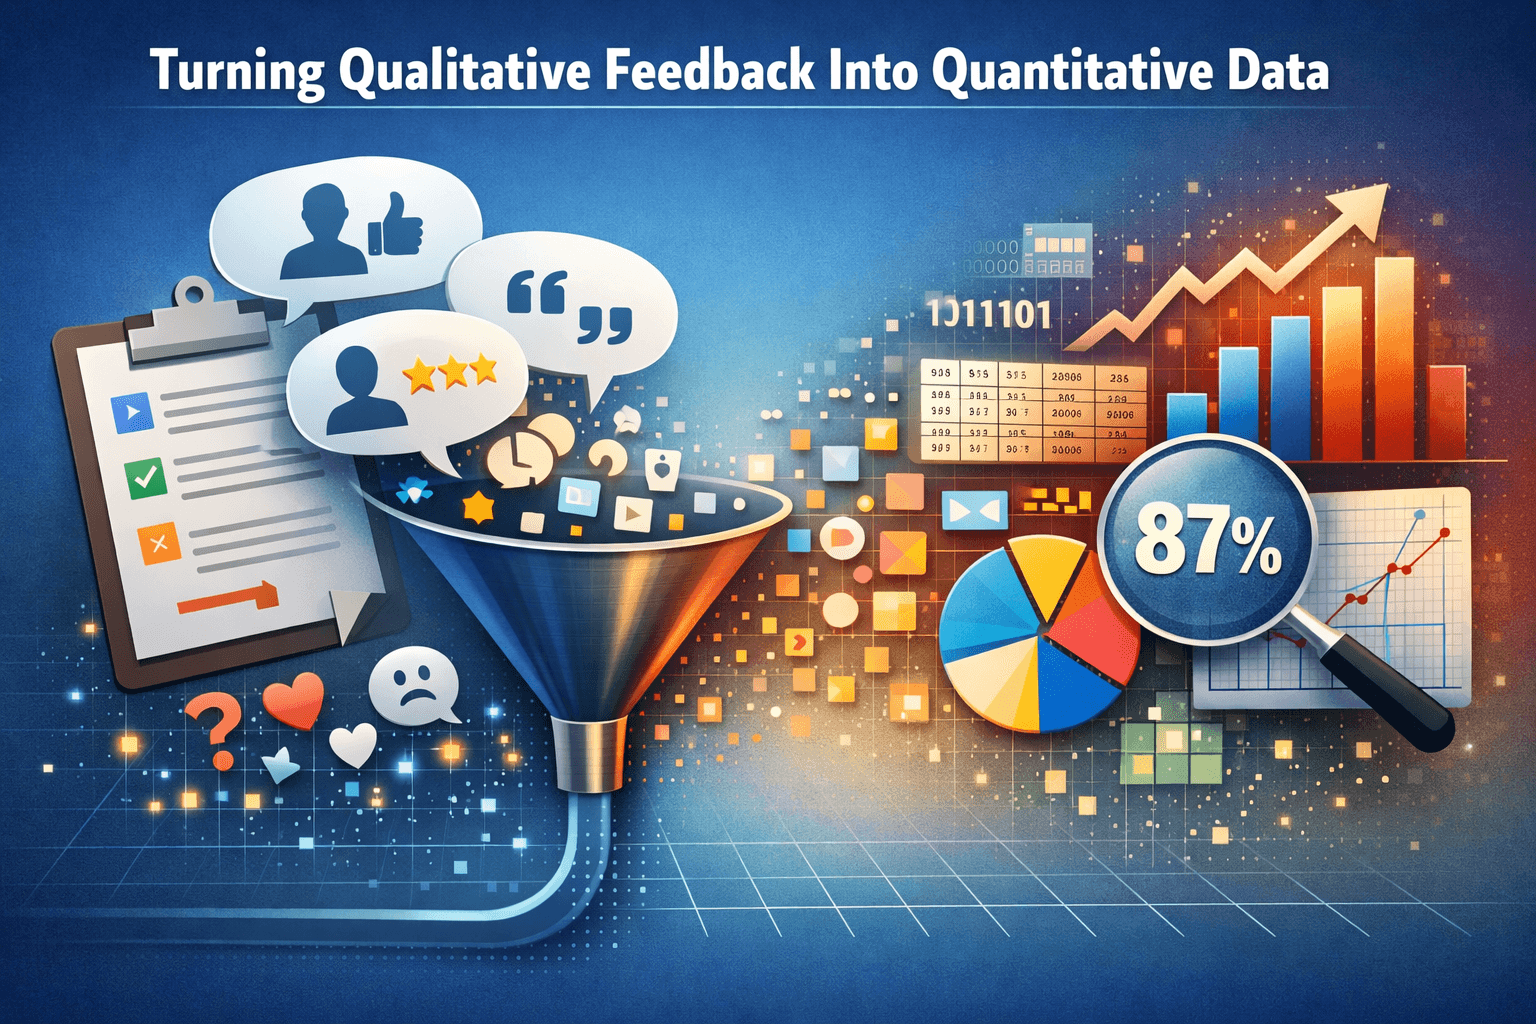
Numbers tell you what happened. Words tell you why. The real power lies in building bridges between the two and knowing when that bridge is worth crossing.
Every evaluator, researcher, and programme manager eventually faces the same dilemma: their most important data is sitting in open-ended responses, interview transcripts, and focus group notes rich, textured, full of insight but impossible to summarise in a table or present in a board report. The pressure to quantify is real. Funders want percentages. Dashboards want numbers. Evidence frameworks want scores.
So the question becomes: can you turn what people say into something you can count without losing what made it meaningful in the first place?
The answer is yes. But it requires intention, method, and a healthy respect for what quantification cannot do.
Why qualitative data alone is never enough
Qualitative data is extraordinary at surfacing nuance. A participant who says "the training was good but the timing was terrible for farmers during harvest season" gives you something no Likert scale can fully capture. That insight might change your entire programme delivery model.
But it cannot tell you how many participants felt that way. It cannot tell you whether the sentiment was isolated or systemic. And without that, the decision-maker cannot act with confidence.
"A quote from one participant is anecdote. The same theme coded across 200 responses becomes evidence."
This is the core tension in mixed-methods work: qualitative data is persuasive in the particular, but vulnerable in the general. Quantifying it done carefully extends its reach without erasing its depth.
Four approaches that actually work
01 Thematic coding
Assign tags to recurring ideas in open responses, then count frequency. The most foundational approach.
02 Sentiment scoring
Rate the emotional valence of responses positive, neutral, negative then aggregate across groups or time.
03 Rubric-based scoring
Apply a structured scoring framework to narrative responses. Each dimension gets a numeric value.
04 Forced-choice conversion
Use follow-up closed questions to confirm and quantify themes surfaced in open responses
Each method has a different risk profile and a different level of interpretive effort. Thematic coding is the most transparent and reproducible. Sentiment scoring is fastest but most prone to coder bias. Rubric-based scoring is powerful but requires upfront design discipline. Forced-choice conversion is the cleanest but only works if you planned for it before data collection.
What the conversion actually looks like
To make this concrete, consider how raw participant statements are transformed into measurable data points:
"I didn't understand most of the handouts they were too technical."
Comprehension score: 2/5
Theme frequency: 1 occurrence tagged "material clarity
"The facilitator was very patient and made sure everyone caught up."
Sentiment: positive
Sub-theme code: "facilitator responsiveness"
"This is the third workshop I've attended but the first one where I felt safe to ask questions."
New indicator identified: % of participants reporting psychologically safe environment
Notice what happens in the third example: the qualitative response doesn't just confirm something you already measured — it surfaces a dimension you hadn't thought to measure. This is one of the most powerful roles qualitative data plays in an M&E system: indicator discovery.
Build the bridge before you collect the data
The most common mistake in mixed-methods research is treating qualitative-to-quantitative conversion as a post-hoc rescue operation. Analysts receive a pile of open-ended responses after data collection ends and are asked to "make them useful." The result is usually rushed coding, unverified themes, and numbers that look credible but aren't.
The far better approach is to design for conversion from the start. This means:
Pairing open and closed questions intentionally
When you include an open-ended question in your survey, ask yourself: what structured question would confirm or quantify the themes I expect to emerge? Place it nearby. When themes do emerge, your closed question becomes the quantifier — and the open response becomes the evidence.
Defining your codebook before analysis
A codebook written before you read the data is far more defensible than one written after. Pre-defining your thematic categories forces clarity about what you are actually trying to measure and protects against the very human tendency to find patterns that confirm your expectations.
Using more than one coder
Inter-rater reliability is the key quality check in qualitative coding. If two independent coders assign the same themes to the same responses more than 80% of the time, your quantified results mean something. Below that threshold, your numbers are measuring your coders' opinions more than your participants' experiences.
A caution worth holding: Not all qualitative data should be quantified. The goal of conversion is always to extend the analytical reach of meaning, not to dress up a number for its own sake. If a theme appears in 3 out of 200 responses, it probably should not become a headline indicator — but it might be exactly the most important finding in your report. The art is in knowing the difference.
Where digital data collection makes this easier
One of the persistent challenges in qualitative-to-quantitative conversion is the sheer friction of the process: transcribing interviews, cleaning open-text responses, building coding systems across spreadsheets that weren't designed for it.
Platforms built for structured data collection where open-ended questions sit alongside scaled and categorical ones in the same instrument remove much of this friction. When your survey is designed as an integrated instrument rather than a qualitative tool and a quantitative tool bolted together, the conversion workflow is already embedded in how the data is captured.
This is particularly important across the event or programme lifecycle. Pre-activity surveys that capture baseline sentiment and open narratives can be designed to mirror post-activity instruments making before-and-after comparison not just possible but rigorous. The qualitative responses at each stage become contextual evidence for the quantitative shifts you are measuring.
The goal was never to replace what people say with numbers. It was always to let what people say travel further — into reports, into decisions, into systems that respond. Done well, quantification is not the enemy of qualitative depth. It is its amplifier.
M&E, Qualitative research, Survey design, Mixed methods, Data collection and KAPsurvey