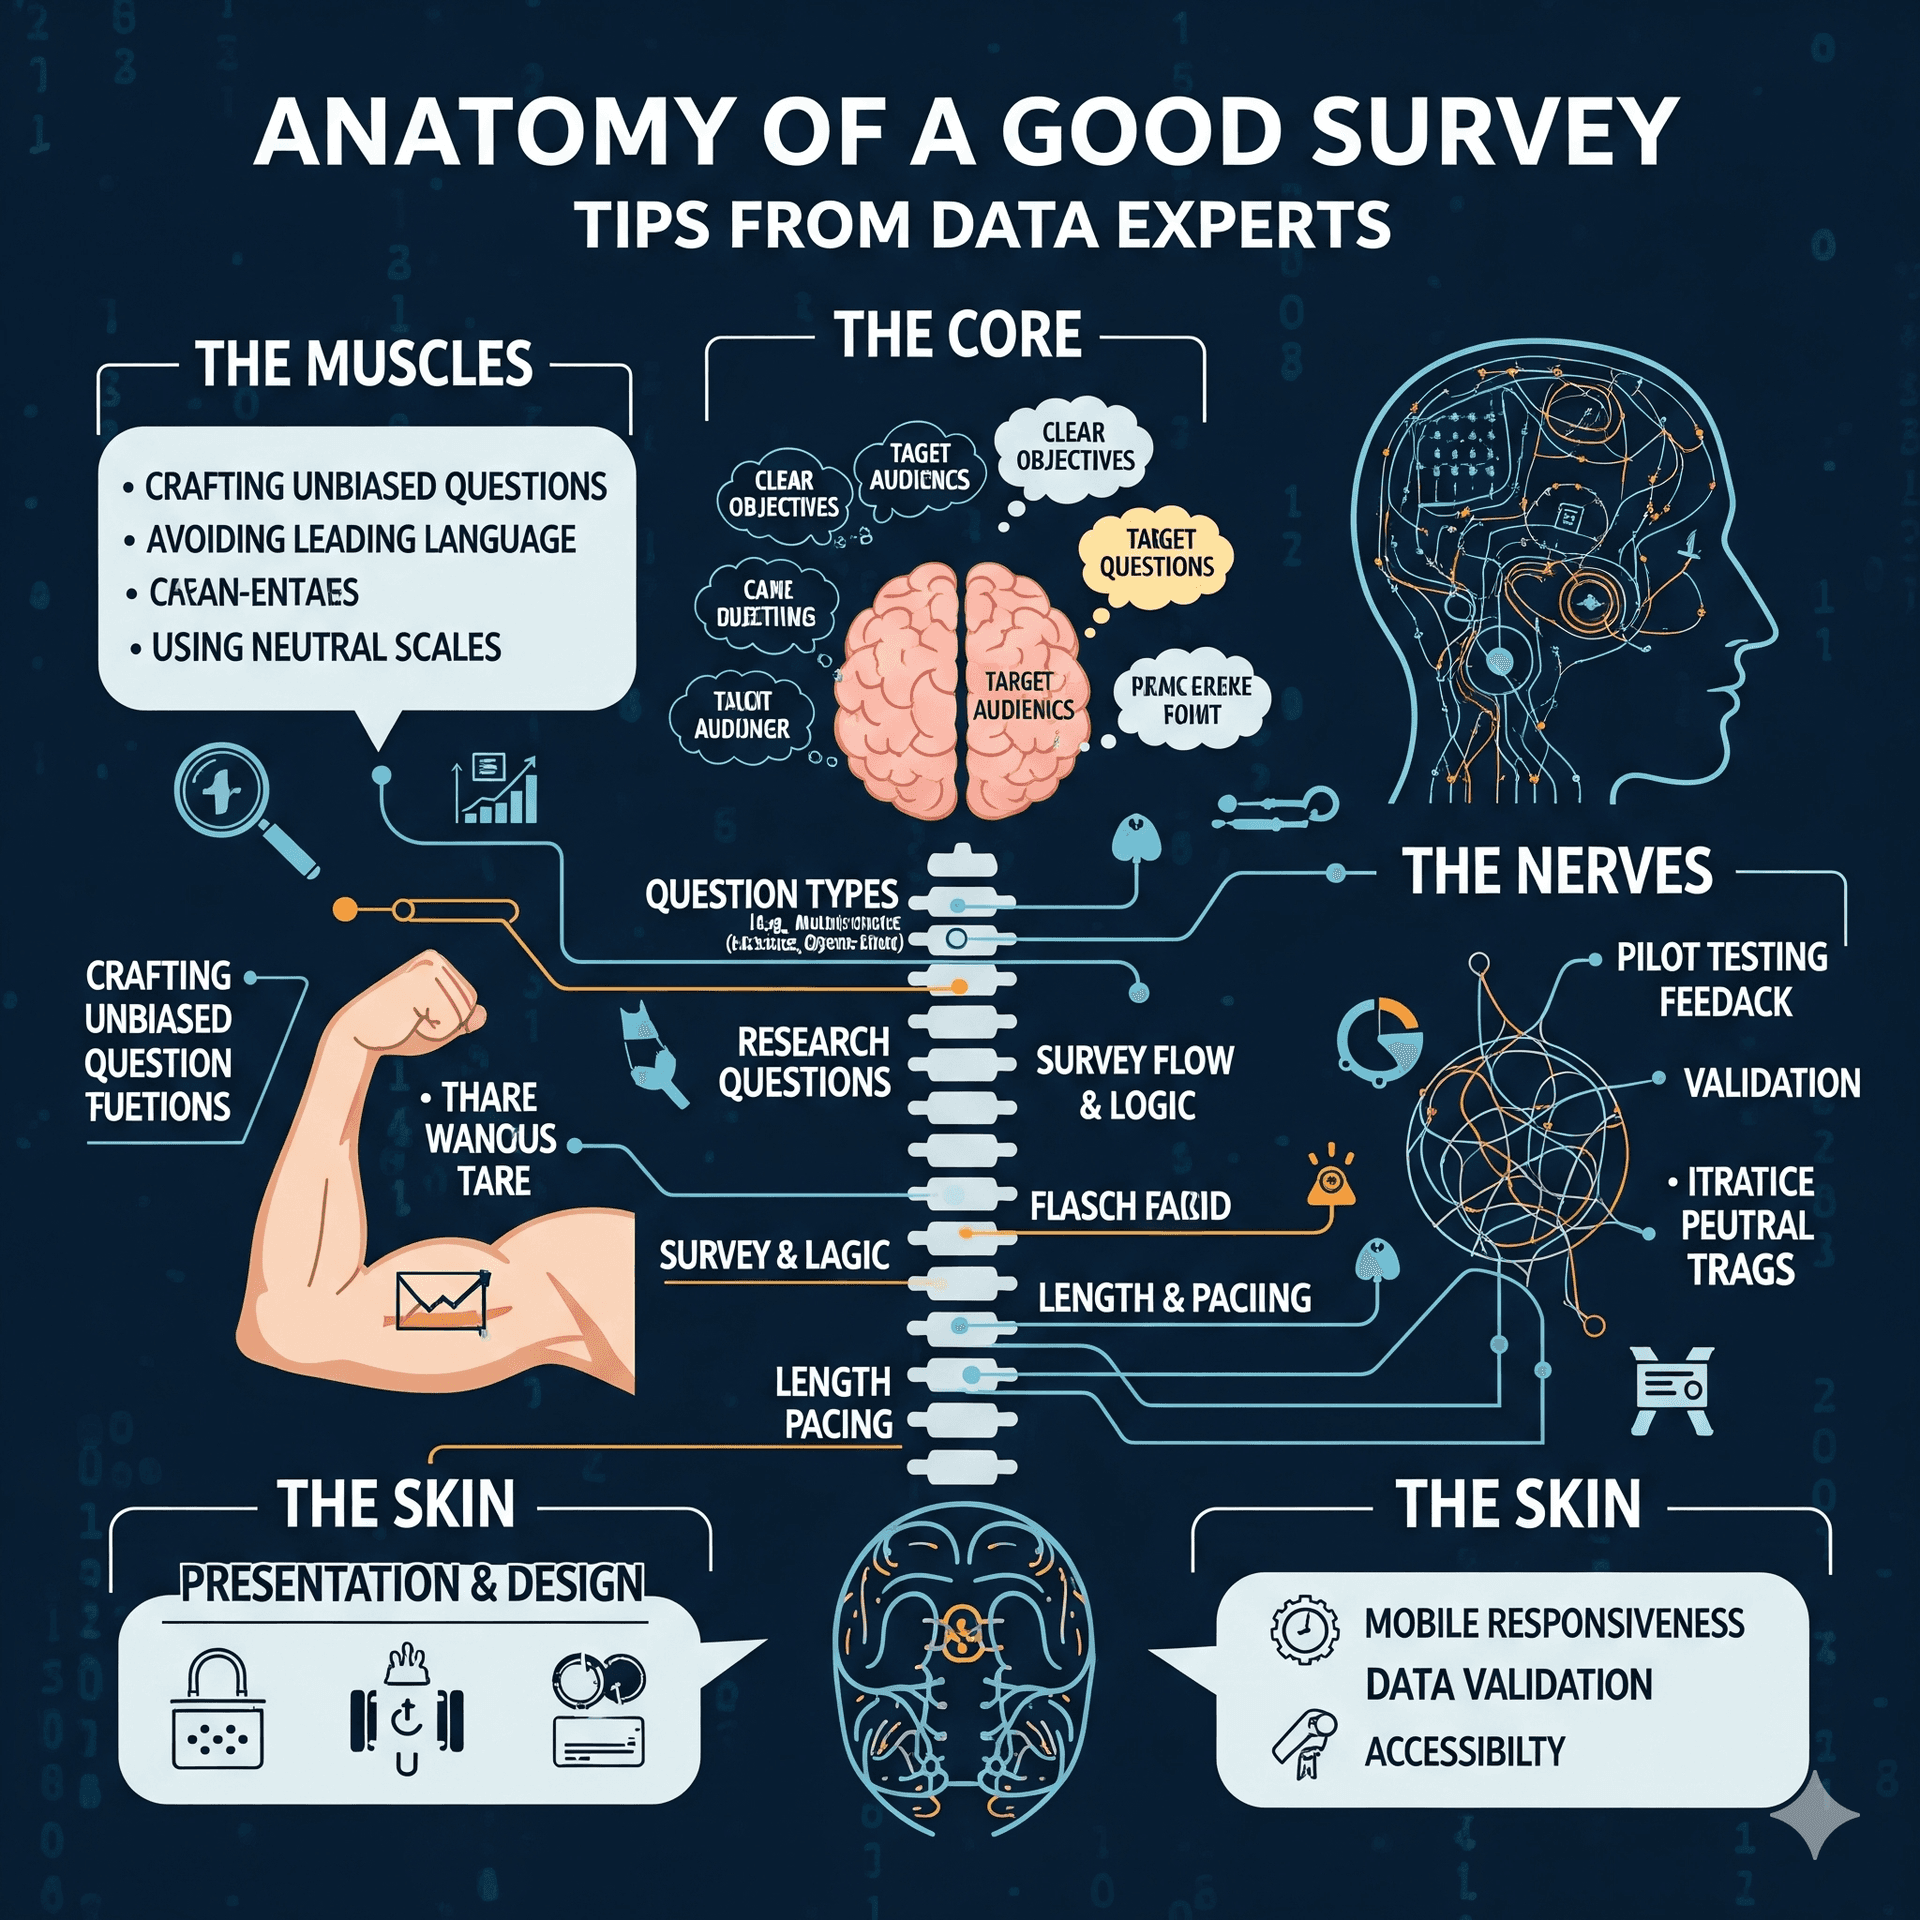
A practical guide to sampling, question design, skip logic, piloting, and avoiding the most common survey pitfalls.
Surveys are deceptively simple. A few questions, a link, some responses and suddenly you have 'data.' But behind every meaningful survey is a disciplined process that most people skip. Poorly designed surveys don't just waste respondents' time; they produce misleading conclusions that can drive costly decisions in the wrong direction.
We spoke with research methodologists, data scientists, and UX researchers to distill what separates a survey that generates insight from one that generates noise. Here's what they had to say.
1. Sampling: Who You Ask Matters as Much as What You Ask
The most elegant questionnaire is worthless if it reaches the wrong audience. Sampling the process of selecting who participates in your survey is the foundation of any credible study.
Define Your Population First
Before sending a single email, be precise about who your survey is actually for. Are you studying customers who purchased in the last 90 days? Adults aged 25–44 in urban areas? First-generation college students? Vague populations produce vague insights.
Probability vs. Non-Probability Sampling
Probability sampling (random selection) is the gold standard because every member of your target population has a known chance of being included. Non-probability methods like convenience sampling or snowball sampling are faster and cheaper, but introduce selection bias. Know which you're using and acknowledge the limitations in how you report your findings.
Expert Tip: "Convenience samples are fine for exploratory work, but never generalize from them as if they were random. Label your methodology honestly." Senior Research Analyst, consumer insights firm
Sample Size: Bigger Isn't Always Better
A common misconception is that larger samples always produce better data. What matters more is representativeness. A well-drawn sample of 400 will outperform a biased sample of 4,000. Use a sample size calculator based on your desired confidence level (typically 95%), margin of error (±5% is standard), and expected response rate. For most organizational surveys, 200–400 complete responses is sufficient for meaningful analysis.
2. Question Design: The Art of Asking Without Leading
Questions are the beating heart of any survey. Poorly worded questions introduce bias before a single answer is recorded. Here's how experts approach question design.
Use Clear, Simple Language
Write at a 6th-to-8th grade reading level. Avoid jargon, acronyms, and double-barreled questions (those that ask about two things at once). "How satisfied are you with our price and quality?" is a classic trap these are two separate questions.
Match Question Type to Your Goal
• Likert scales (Strongly Agree to Strongly Disagree) work well for attitudes and opinions.
• Rating scales (1–10) are effective for intensity measures like satisfaction or likelihood.
• Multiple choice is best for categorical data with known options.
• Open-ended questions yield rich qualitative detail but are harder to analyze at scale.
• Matrix questions are efficient for comparing multiple items on the same scale but use them sparingly, as respondents often 'straightline' (select the same answer for every row).
Avoid Leading and Loaded Questions
Leading questions nudge respondents toward a particular answer. "How much did you enjoy our excellent customer service?" assumes enjoyment. A neutral version: "How would you describe your experience with our customer service?" Similarly, avoid emotionally charged language that triggers a reaction before the respondent can think.
Expert Tip: "Run your questions through a bias checklist. For every question, ask: does the wording make any answer more socially desirable than another? If yes, rewrite." Behavioral Economist & Survey Methodologist
Order Effects: Sequence Changes Answers
The order in which questions appear influences responses. Early questions prime how respondents think about later ones. As a rule: start with broad, easy questions to build engagement; place sensitive or demographic questions toward the end; and if measuring attitudes, ask for overall impressions before drilling into specifics.
3. Skip Logic: Building an Intelligent Survey Flow
Skip logic (also called branching or conditional logic) routes respondents to different questions based on their previous answers. Used well, it creates a personalized experience and reduces irrelevant questions. Used poorly, it creates confusion and broken survey paths.
When to Use Skip Logic
• To filter out respondents who don't meet a condition (e.g., skip product-specific questions for non-users).
• To follow up on specific answers (e.g., ask why a respondent rated satisfaction as 'low').
• To branch between customer segments with meaningfully different experiences.
• To skip demographic questions for returning respondents in panel surveys.
Rules for Implementing Skip Logic
Keep your branching tree as simple as possible. Complex nested logic is a maintenance nightmare and a source of errors. Draw your survey flow as a diagram before building it in your platform. Test every path not just the most common ones. A respondent who answers "No" to your first question should never land on a question that assumes "Yes."
Expert Tip: "I've seen surveys where 30% of respondents hit a broken skip path and either saw irrelevant questions or got stuck. Always QA every branch, including the edge cases." UX Researcher, enterprise software company
Avoid Over-Branching
If your survey branches more than 3–4 levels deep, reconsider your design. You may be trying to do too much in one survey. Segment your audience upfront and create separate, shorter surveys for each group this almost always produces better data and a better respondent experience.
4. Piloting: Test Before You Launch
Even experienced survey designers pilot their surveys. A pilot is a small-scale test run with 5–20 people from your target population (or similar) before the full launch. It's the single most cost-effective quality check available.
What to Look for in a Pilot
• Comprehension: Do respondents understand each question the way you intended?
• Timing: How long does the survey actually take? (People consistently underestimate this.)
• Drop-off points: Where do respondents abandon the survey? High abandonment signals a problem.
• Logic errors: Are all skip paths working correctly?
• Response distributions: Are respondents clustering in unexpected places? This might indicate a poorly calibrated scale.
Cognitive Interviewing: Go Deeper
For high-stakes surveys, consider cognitive interviewing sitting with a handful of pilot respondents and asking them to 'think aloud' as they answer. This reveals misinterpretations that standard pilot data won't surface. It sounds time-consuming; in practice, five cognitive interviews routinely catch the issues that sink surveys.
Iterate Before You Scale
Treat the pilot as a true iteration cycle, not a rubber stamp. Make necessary changes, then pilot again if the revisions are substantial. The cost of revising a survey mid-field invalidating already-collected responses far exceeds the cost of an extra round of piloting.
5. Common Mistakes (and How to Avoid Them)
Even seasoned researchers fall into predictable traps. Here are the ones data experts flag most often.
Making the Survey Too Long
Response quality degrades rapidly after 10–12 minutes. Respondents rush, skip questions, or abandon altogether. Every question should earn its place. Ask yourself: if this question were removed, would it materially affect our conclusions? If the answer is no, cut it.
Ignoring Non-Response Bias
The people who don't complete your survey are not randomly distributed. They often differ systematically from those who do respond which can skew your results dramatically. Track your response rate, compare responders to non-responders where possible, and be explicit about this limitation in your reporting.
Using Poorly Calibrated Scales
Scales without a midpoint force respondents into a stance they may not hold. Scales that are too long (15 points) introduce false precision. A 5- or 7-point scale with labeled endpoints and a clear midpoint is generally optimal for most attitudinal measures.
Treating All Missing Data the Same
There's a critical difference between "did not respond" and "skipped this question" and "question was not shown due to skip logic." Your data collection platform should track these separately, and your analysis should handle them differently. Lumping them together corrupts your results.
Reporting Percentages Without Context
"72% of respondents agree" means nothing without knowing the base (n=18? n=1,800?), the exact question wording, and the response options available. Always provide this context, whether in an appendix or inline with your findings.
Expert Tip: "The most dangerous survey mistake isn't a bad question it's false confidence in bad data. Always report the limitations of your methodology alongside your findings." Data Science Lead, market research consultancy
Final Thoughts
A good survey is not an accident. It's the product of intentional design decisions at every stage, from who you ask, to how you ask it, to how you interpret the silence of those who didn't respond at all. The techniques covered here aren't reserved for academic researchers with large budgets. They're practical disciplines that any team can adopt with modest investment in process.
The payoff is substantial: data you can trust, insights that hold up to scrutiny, and decisions made on solid ground rather than wishful thinking.