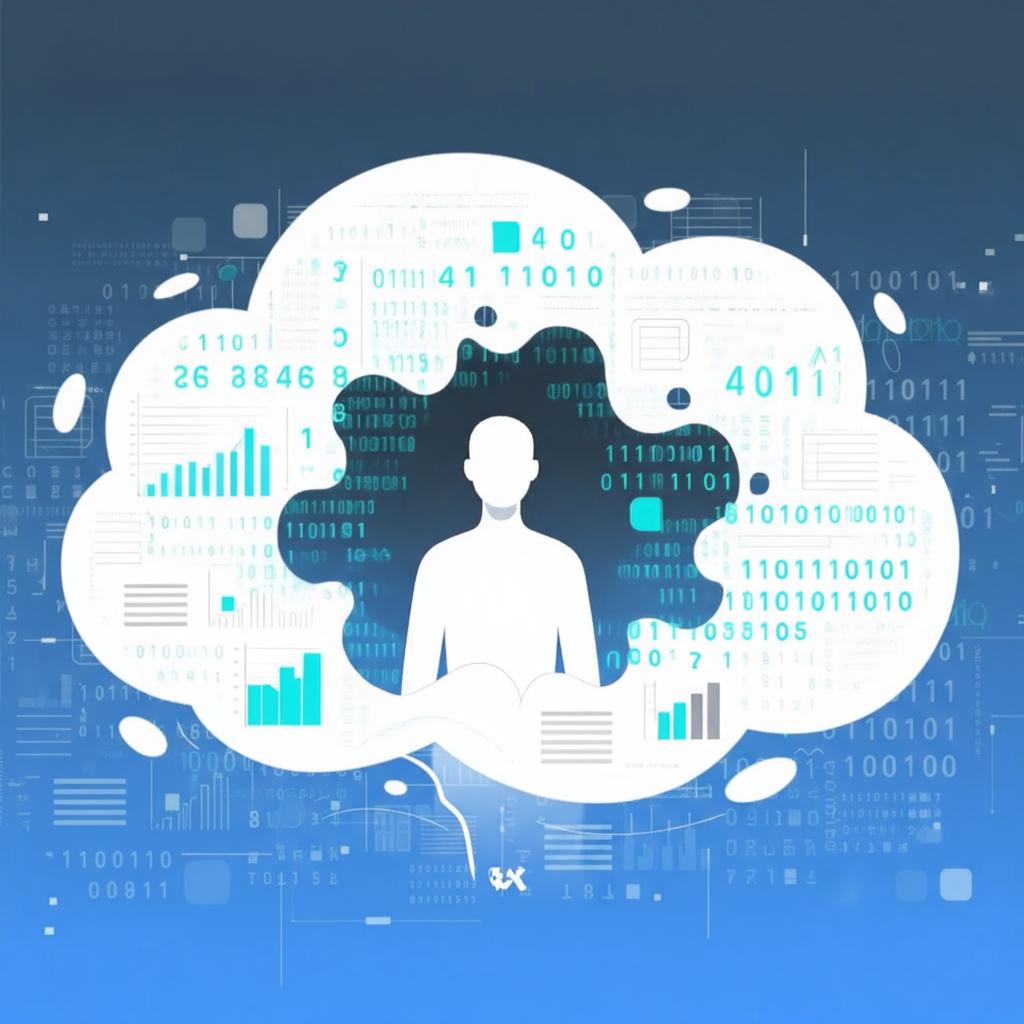
Why Big Data Is Blinding Us
We are living in the age of the dashboard. In boardrooms and on marketing calls, we are surrounded by metrics, KPIs, and real-time data streams. Big data has given us an unprecedented view of what is happening in our markets, organizations, and communities. We can track clicks, monitor supply chains, and predict user churn with astonishing accuracy.
But this power has created a profound vulnerability.
In a recent, sharp analysis titled, "Is big data blinding us to the human story?" (Rennie, 2025), the author hits on a key challenge we all face. We have become so obsessed with the data points we can easily collect and measure that we are increasingly blind to the ones we can't. This is "quantification bias," and it’s a dangerous trap.
It's the illusion of knowledge. We see the numbers move, but we have no idea why. We've lost the "human story." This is where we must bridge the gap between abstract data and human reality.
The "What" Without the "Why": The Limits of Big Data
Big data is brilliant at showing correlation and scale. It can tell you, for example, that 75% of users abandon their shopping carts at the payment stage. It can tell you that a new public health initiative is seeing low enrollment in a specific region. It can even show that employees in one department are 50% less likely to use a new software tool.
The data provides the what. But it cannot, by itself, provide the why.
Why did the users abandon their carts? Was the shipping cost a surprise? Did the site feel untrustworthy? Was the guest checkout too hard to find?
Why is health enrollment low? Is it a lack of trust in the institution? Are there cultural beliefs that conflict with the program? Is there simple misinformation spreading through the community?
This is the blind spot. When faced with this gap, organizations often guess. They "optimize" the wrong things; tweaking a button color when the real problem is a deep-seated lack of trust. They run A/B tests on headlines when the core issue is that the audience fundamentally misunderstands the product's value. They see the "Practice" (the pattern of behavior) and try to change it, without ever understanding the "Knowledge" or "Attitudes" that drive it.
Uncovering the "Thick Data": The Role of the KAP Survey
This is precisely where we must turn to a different kind of tool; one designed not to count, but to understand. The article calls for "thick data," a term from ethnography that describes the rich, contextual, qualitative data that reveals the human story.
It immediately made me think of the value of the KAPsurvey.
A Knowledge, Attitudes, and Practices (KAP) survey is a structured methodology designed to do exactly what big data misses. It systematically uncovers the human drivers behind the numbers.
While our big data analytics might show a pattern (the "Practice"), a KAP survey is how we uncover the underlying beliefs, cultural context, and information gaps that drive that pattern.
Let's break it down:
- Knowledge: What does the audience actually know? What information do they have, and where did they get it? Crucially, what misinformation or information gaps exist? You might find that your "practice" problem (low enrollment) is really a "knowledge" problem (people think the program is not for them).
- Attitudes: This is the core of the "why." What does the audience believe, feel, and value? What are their cultural norms, their fears, their motivations, their judgments, and their perceptions of social pressure? This is where you find out why they don't trust your checkout process or why a health message isn't landing.
- Practices: What do people actually do? A KAP survey captures self-reported behaviors. This can be fascinating when compared to big data. When the big data (what they do) and the KAP data (what they say they do) don't align, you’ve found a point of friction; often rooted in shame, social desirability, or simple misremembering. This misalignment is, in itself, a critical insight.
A KAP survey gives you the human story. It tells you why the numbers look the way they do.
Data Synergy: The Complete Picture
The future isn't about choosing between big data and qualitative insights. It's about data synergy. It’s about using both to get a complete picture.
A smart organization uses big data to identify a problem at scale. It tells them, "The fire is in this part of the forest."
A wise organization then uses a KAP survey to fly in and understand why the fire started. It's the diagnostic tool that reveals the cause.
- Big data showed a 75% cart abandonment.
- The KAP survey revealed that a new "trust badge" on the site was perceived (Attitude) as a scam, and users didn't know (Knowledge) if their data was secure.
The solution isn't to change the cart's color. The solution is to change the trust badge and provide clear, simple messaging about data security. One solution is a guess; the other is a human-centered, evidence-based intervention.
To escape "quantification bias," we must have the courage to ask "why?" and the right tools to get the answer. Big data provides the map, but a KAP survey provides the key. By combining the "what" from big data with the "why" from a KAPsurvey, we stop being blind to the human story and start making decisions that truly connect.
At KAPsurvey.com, we specialize in finding that "why."
Reference
Rennie. (2025). Is big data blinding us to the human story? CIO South Africa. Retrieved from https://cio-sa.co.za/articles/is-big-data-blinding-us-to-the-human-story/